Milestone 1: EDA

Milestone 1: EDA

# Setup - Run only once per Kernel App
%conda install openjdk -y

# install PySpark
%pip install pyspark==3.4.0

# restart kernel
from IPython.core.display import HTML
HTML("<script>Jupyter.notebook.kernel.restart()</script>")
Collecting package metadata (current_repodata.json): done
Solving environment: done


==> WARNING: A newer version of conda exists. <==
  current version: 23.3.1
  latest version: 24.3.0

Please update conda by running

    $ conda update -n base -c defaults conda

Or to minimize the number of packages updated during conda update use

     conda install conda=24.3.0


## Package Plan ##

  environment location: /opt/conda

  added / updated specs:
    - openjdk


The following packages will be downloaded:

    package                    |            build
    ---------------------------|-----------------
    ca-certificates-2024.3.11  |       h06a4308_0         127 KB
    certifi-2024.2.2           |  py310h06a4308_0         159 KB
    openjdk-11.0.13            |       h87a67e3_0       341.0 MB
    ------------------------------------------------------------
                                           Total:       341.3 MB

The following NEW packages will be INSTALLED:

  openjdk            pkgs/main/linux-64::openjdk-11.0.13-h87a67e3_0 

The following packages will be UPDATED:

  ca-certificates    conda-forge::ca-certificates-2023.11.~ --> pkgs/main::ca-certificates-2024.3.11-h06a4308_0 
  certifi            conda-forge/noarch::certifi-2023.11.1~ --> pkgs/main/linux-64::certifi-2024.2.2-py310h06a4308_0 


Downloading and Extracting Packages
openjdk-11.0.13      | 341.0 MB  |                                       |   0% 
certifi-2024.2.2     | 159 KB    |                                       |   0% 

ca-certificates-2024 | 127 KB    |                                       |   0% 

ca-certificates-2024 | 127 KB    | ##################################### | 100% 


Preparing transaction: done
Verifying transaction: done
Executing transaction: done

Note: you may need to restart the kernel to use updated packages.
Collecting pyspark==3.4.0
  Using cached pyspark-3.4.0-py2.py3-none-any.whl
Collecting py4j==0.10.9.7 (from pyspark==3.4.0)
  Using cached py4j-0.10.9.7-py2.py3-none-any.whl.metadata (1.5 kB)
Using cached py4j-0.10.9.7-py2.py3-none-any.whl (200 kB)
Installing collected packages: py4j, pyspark
Successfully installed py4j-0.10.9.7 pyspark-3.4.0
WARNING: Running pip as the 'root' user can result in broken permissions and conflicting behaviour with the system package manager. It is recommended to use a virtual environment instead: https://pip.pypa.io/warnings/venv

[notice] A new release of pip is available: 23.3.1 -> 24.0
[notice] To update, run: pip install --upgrade pip
Note: you may need to restart the kernel to use updated packages.
# Import pyspark and build Spark session
from pyspark.sql import SparkSession

spark = (
    SparkSession.builder.appName("PySparkApp")
    .config("spark.jars.packages", "org.apache.hadoop:hadoop-aws:3.2.2")
    .config(
        "fs.s3a.aws.credentials.provider",
        "com.amazonaws.auth.ContainerCredentialsProvider",
    )
    .getOrCreate()
)

print(spark.version)
Warning: Ignoring non-Spark config property: fs.s3a.aws.credentials.provider
Ivy Default Cache set to: /root/.ivy2/cache
The jars for the packages stored in: /root/.ivy2/jars
org.apache.hadoop#hadoop-aws added as a dependency
:: resolving dependencies :: org.apache.spark#spark-submit-parent-adb82c2e-cea6-4fd3-9970-fa4451ede9d0;1.0
    confs: [default]
    found org.apache.hadoop#hadoop-aws;3.2.2 in central
    found com.amazonaws#aws-java-sdk-bundle;1.11.563 in central
:: resolution report :: resolve 388ms :: artifacts dl 33ms
    :: modules in use:
    com.amazonaws#aws-java-sdk-bundle;1.11.563 from central in [default]
    org.apache.hadoop#hadoop-aws;3.2.2 from central in [default]
    ---------------------------------------------------------------------
    |                  |            modules            ||   artifacts   |
    |       conf       | number| search|dwnlded|evicted|| number|dwnlded|
    ---------------------------------------------------------------------
    |      default     |   2   |   0   |   0   |   0   ||   2   |   0   |
    ---------------------------------------------------------------------
:: retrieving :: org.apache.spark#spark-submit-parent-adb82c2e-cea6-4fd3-9970-fa4451ede9d0
    confs: [default]
    0 artifacts copied, 2 already retrieved (0kB/21ms)
24/04/02 04:08:19 WARN NativeCodeLoader: Unable to load native-hadoop library for your platform... using builtin-java classes where applicable
Setting default log level to "WARN".
To adjust logging level use sc.setLogLevel(newLevel). For SparkR, use setLogLevel(newLevel).
:: loading settings :: url = jar:file:/opt/conda/lib/python3.10/site-packages/pyspark/jars/ivy-2.5.1.jar!/org/apache/ivy/core/settings/ivysettings.xml
3.4.0

Load the datasets

%%time
import sagemaker
session = sagemaker.Session()
bucket = session.default_bucket()
output_prefix_data_comments = "finalproject/comments/yyyy=*"
s3_path = f"s3a://{bucket}/{output_prefix_data_comments}"
#s3_path = "s3a://sagemaker-us-east-1-527047370587/project/comments/yyyy=2021/425151 part-00000-28396f0a-9f66-4e79-bdee-5a0fcc71cf24-c000.snappy.parquet"
print(f"reading comments from {s3_path}")
comments = spark.read.parquet(s3_path, header=True)
sagemaker.config INFO - Not applying SDK defaults from location: /etc/xdg/sagemaker/config.yaml
sagemaker.config INFO - Not applying SDK defaults from location: /root/.config/sagemaker/config.yaml
sagemaker.config INFO - Not applying SDK defaults from location: /etc/xdg/sagemaker/config.yaml
sagemaker.config INFO - Not applying SDK defaults from location: /root/.config/sagemaker/config.yaml
reading comments from s3a://sagemaker-us-east-1-527047370587/finalproject/comments/yyyy=*
CPU times: user 2.49 s, sys: 405 ms, total: 2.89 s
Wall time: 9.75 s
24/04/02 04:08:28 WARN MetricsConfig: Cannot locate configuration: tried hadoop-metrics2-s3a-file-system.properties,hadoop-metrics2.properties
                                                                                
# display a subset of columns
comments.select("subreddit", "author", "body", "parent_id", "link_id", "id", "created_utc","score").show()
[Stage 1:>                                                          (0 + 1) / 1]                                                                                
+----------+--------------------+--------------------+----------+---------+-------+-------------------+-----+
| subreddit|              author|                body| parent_id|  link_id|     id|        created_utc|score|
+----------+--------------------+--------------------+----------+---------+-------+-------------------+-----+
|      news|            Sulaco99|           Why wait?|t1_gid6yr4|t3_krvwkf|gid7nhx|2021-01-07 00:22:43|    1|
|      news|  jeopardy_themesong|The tweet is gone...|t1_gicxxdr|t3_krvwkf|gid7ni1|2021-01-07 00:22:43|    1|
|      news|   West_Incident9552|You should probab...|t1_gid72ei|t3_krvwkf|gid7njz|2021-01-07 00:22:43|    4|
|      news|      StatusReality4|You wouldn't be a...|t1_gid6aea|t3_krvwkf|gid7nm5|2021-01-07 00:22:44|   14|
|      news|              5omkiy|I believe the ter...|t1_gid79xs|t3_krvwkf|gid7nmz|2021-01-07 00:22:44|    5|
|      news|      AnneONymous125|Peep the video I ...|t1_gid705n|t3_krzopk|gid7nnk|2021-01-07 00:22:44|    3|
|      news|       SpeedflyChris|He's sent a viole...|t1_gid77lu|t3_krzopk|gid7no0|2021-01-07 00:22:45|   42|
|      news|Anothernamelesacount|As much as I woul...|t1_gid606v|t3_krzopk|gid7nqo|2021-01-07 00:22:46|    2|
|      news|           [deleted]|Snurchy, i think ...|t1_gid2a7o|t3_kr8gb6|gid7nrf|2021-01-07 00:22:46|    2|
|Futurology|           FuzziBear|i don’t think it’...|t1_gicw2h8|t3_krn3ft|gid7nsa|2021-01-07 00:22:46|    2|
|      news|           JustJeezy|I’m trying not to...|t1_gid781s|t3_krzopk|gid7ntz|2021-01-07 00:22:47|    0|
|      news|BretTheShitmanFart69|It seems like thi...|t1_gid6ap7|t3_krzopk|gid7nwx|2021-01-07 00:22:48|    2|
|      news|         BingoBarnes|         Gravy Seals|t1_gid5pzu|t3_krzopk|gid7nzk|2021-01-07 00:22:49|    1|
|      news|       Spocks_Goatee|Can you back up y...|t1_gid7fvq|t3_krvwkf|gid7o0r|2021-01-07 00:22:49|   10|
|      news|          prodigymix|You must've just ...|t1_gid7i9c|t3_krvwkf|gid7o20|2021-01-07 00:22:49|   17|
|      news|      DontDropThSoap|They will be prot...|t1_gid71o5|t3_krzopk|gid7o3o|2021-01-07 00:22:50|    9|
|      news|           [deleted]|           [deleted]|t1_gid79xs|t3_krvwkf|gid7o5g|2021-01-07 00:22:51|   -9|
|      news|         mgd09292007|Today I found mys...| t3_krvwkf|t3_krvwkf|gid7o5p|2021-01-07 00:22:51|   86|
|      news|           [deleted]|           [removed]| t3_krzopk|t3_krzopk|gid7o5r|2021-01-07 00:22:51|    1|
|      news|           [deleted]|           [deleted]|t1_gid76dl|t3_krvwkf|gid7o6b|2021-01-07 00:22:51|    0|
+----------+--------------------+--------------------+----------+---------+-------+-------------------+-----+
only showing top 20 rows
%%time
output_prefix_data_submissions = f"finalproject/submissions/yyyy=*"
s3_path = f"s3a://{bucket}/{output_prefix_data_submissions}"
print(f"reading submissions from {s3_path}")
submissions = spark.read.parquet(s3_path, header=True)
reading submissions from s3a://sagemaker-us-east-1-527047370587/finalproject/submissions/yyyy=*
CPU times: user 1.28 ms, sys: 3.18 ms, total: 4.46 ms
Wall time: 1.26 s
24/04/02 04:08:38 WARN package: Truncated the string representation of a plan since it was too large. This behavior can be adjusted by setting 'spark.sql.debug.maxToStringFields'.
# display a subset of columns
submissions.select("subreddit", "author", "title", "selftext", "created_utc", "num_comments","score").show()
+----------+--------------------+--------------------+---------+-------------------+------------+-----+
| subreddit|              author|               title| selftext|        created_utc|num_comments|score|
+----------+--------------------+--------------------+---------+-------------------+------------+-----+
|      news|           [deleted]|New Warp Drive Mo...|[deleted]|2021-03-30 10:52:37|           0|    1|
|      news|First-Situation-1384|UNICAL CES admiss...|         |2021-03-30 10:54:26|           0|    1|
|      news|             bustead|Attack on Asian W...|         |2021-03-30 10:55:12|           0|    5|
|      news|     Som2ny-Official|'Nomadland' wins ...|         |2021-03-30 10:55:50|           0|    1|
|      news|           pm30music|دانلود آهنگ کردی ...|         |2021-03-30 10:56:28|           0|    1|
|      news|    Anon-fickleflake|Ireland to promot...|         |2021-03-30 10:57:10|           0|    1|
|      news|First-Situation-1384|Newspaper Mistake...|         |2021-03-30 10:57:29|           0|    1|
|      news| DPRK_JUCHE_IDEOLOGY|River Improvement...|         |2021-03-30 10:57:30|           0|    1|
|      news|       Benjamin-Info|HOW TO SELL WITH ...|         |2021-03-30 10:57:34|           0|    1|
|      news|        sportifynews|PayPal will let U...|         |2021-03-30 10:58:31|           0|    1|
|      news|  Powerful-Flow-5496|      women's boxers|         |2021-03-30 10:59:02|           0|    1|
|      news|     ana_news_agency|علاقة وثيقة بين ط...|         |2021-03-30 11:00:02|           0|    1|
|      news|   rainbowarriorhere|8.2 TB Of MobiKwi...|         |2021-03-30 11:00:37|           0|    1|
|      news|First-Situation-1384|BBnaija star, Ifu...|         |2021-03-30 11:00:45|           0|    1|
|      news|           [deleted]|MobiKwik data bre...|[deleted]|2021-03-30 11:00:55|           0|    1|
|      news|     Som2ny-Official|  Women's March 2020|         |2021-03-30 11:01:20|           0|    1|
|      news|   rainbowarriorhere|Mobikwik denies d...|         |2021-03-30 11:01:21|           6|  105|
|technology|   rainbowarriorhere|Mobikwik denies d...|         |2021-03-30 11:01:40|           0|    0|
|      news| Right-Bathroom-5287|Adani denies enga...|         |2021-03-30 11:02:08|           0|   18|
|      news|    popularnewsindia|Top 5 Luxury Car ...|         |2021-03-30 11:04:20|           0|    1|
+----------+--------------------+--------------------+---------+-------------------+------------+-----+
only showing top 20 rows

Data Clean

# Filter into different subsets
news_comments = comments[comments['subreddit'] == 'news']
news_submissions = submissions[submissions['subreddit'] == 'news']

future_comments = comments[comments['subreddit'] == 'Futurology']
future_submissions = submissions[submissions['subreddit'] == 'Futurology']

technology_comments = comments[comments['subreddit'] == 'technology']
technology_submissions = submissions[submissions['subreddit'] == 'technology']
# Reformat dates 
import pyspark.sql.functions as F

# Reformat dates directly from UNIX timestamp
news_submissions = news_submissions.withColumn("created_date", F.date_format(F.col('created_utc'), 'yyyy-MM-dd HH:mm:ss'))
news_comments = news_comments.withColumn("created_date", F.date_format(F.col('created_utc'), 'yyyy-MM-dd HH:mm:ss'))
future_submissions = future_submissions.withColumn("created_date", F.date_format(F.col('created_utc'), 'yyyy-MM-dd HH:mm:ss'))
future_comments = future_comments.withColumn("created_date", F.date_format(F.col('created_utc'), 'yyyy-MM-dd HH:mm:ss'))
technology_submissions = technology_submissions.withColumn("created_date", F.date_format(F.col('created_utc'), 'yyyy-MM-dd HH:mm:ss'))
technology_comments = technology_comments.withColumn("created_date", F.date_format(F.col('created_utc'), 'yyyy-MM-dd HH:mm:ss'))
from pyspark.sql.functions import split
# Split date and time columns
news_submissions = news_submissions.withColumn("created_time", F.split(F.col('created_date'), " ")[1])
news_submissions = news_submissions.withColumn("created_date", F.split(F.col('created_date'), " ")[0])
news_comments = news_comments.withColumn("created_time", F.split(F.col('created_date'), " ")[1])
news_comments = news_comments.withColumn("created_date", F.split(F.col('created_date'), " ")[0])

future_submissions = future_submissions.withColumn("created_time", F.split(F.col('created_date'), " ")[1])
future_submissions = future_submissions.withColumn("created_date", F.split(F.col('created_date'), " ")[0])
future_comments = future_comments.withColumn("created_time", F.split(F.col('created_date'), " ")[1])
future_comments = future_comments.withColumn("created_date", F.split(F.col('created_date'), " ")[0])

technology_submissions = technology_submissions.withColumn("created_time", F.split(F.col('created_date'), " ")[1])
technology_submissions = technology_submissions.withColumn("created_date", F.split(F.col('created_date'), " ")[0])
technology_comments = technology_comments.withColumn("created_time", F.split(F.col('created_date'), " ")[1])
technology_comments = technology_comments.withColumn("created_date", F.split(F.col('created_date'), " ")[0])

EDA

1. Investigating Author Contribution in the r/technology and r/Futurology Subreddits

In our analysis, we delve into the distribution of posts by individual authors within the technology domain. Our primary objective is to discern whether a select group of authors dominates the majority of submissions and comments, or if content originates from a diverse range of contributors.

To accomplish this, we aggregate our data by author, examining whether certain individuals contribute significantly more submissions or comments compared to others. By focusing on the top contributors, we aim to understand if a few prolific authors account for a substantial portion of the total submissions and comments in the technology field, thereby elucidating the distribution of authorship within this domain.

r/technology

from pyspark.sql.functions import *
tech_sub_author_count = technology_submissions.groupBy('author').agg(count("author").alias("subs_count")).sort(desc('subs_count'))
tech_com_author_count = technology_comments.groupBy('author').agg(count("author").alias("comments_count")).sort(desc('comments_count'))
tech_sub_author_count.show(10)
tech_com_author_count.show(10)
                                                                                [Stage 7:>                                                          (0 + 4) / 5]                                                                                
+------------------+----------+
|            author|subs_count|
+------------------+----------+
|         [deleted]|     33895|
|        groupsaada|     14461|
|           Sorin61|      2545|
|          Wagamaga|      2343|
|         arnambiar|      2026|
|     kry_some_more|      1754|
|    sagarkangude11|      1397|
|            speckz|      1337|
|Wooden_Working6842|      1229|
|     nareshkumar02|      1127|
+------------------+----------+
only showing top 10 rows

+--------------+--------------+
|        author|comments_count|
+--------------+--------------+
|     [deleted]|       1010940|
| AutoModerator|         56074|
|    veritanuda|          5334|
|  happyscrappy|          4995|
|  DarthBuzzard|          4603|
|     littleMAS|          3573|
|  AmputatorBot|          3483|
|          cryo|          3445|
|      aquarain|          3183|
|WhatTheZuck420|          3181|
+--------------+--------------+
only showing top 10 rows
tech_author_count = tech_sub_author_count.join(tech_com_author_count, "author")
tech_author_count = tech_author_count.na.fill(0)
tech_author_df = tech_author_count.toPandas()
                                                                                
tech_author_df = tech_author_df[tech_author_df['author'] != '[deleted]']
tech_author_df = tech_author_df.set_index('author').astype(int)
tech_author_df['total_count'] = tech_author_df['subs_count'] + tech_author_df['comments_count']
tech_author_df = tech_author_df.reset_index()
tech_author_df.head()
author subs_count comments_count total_count
0 GD_Bats 1 493 494
1 Uhhhhh55 1 16 17
2 immersive-matthew 1 85 86
3 mrstipez 7 141 148
4 RaiderOfZeHater 19 17 36
tech_author_df.to_csv("Technology_Author.csv",index=False)

Total Count

total_number = tech_author_df['total_count'].sum()
print('Total Number:', total_number)
print('30% Number:', int(total_number*.3))
print('20% Number:', int(total_number* .2))
Total Number: 369359
30% Number: 110807
20% Number: 73871
topn_number = tech_author_df.sort_values(by='total_count', ascending=False)['total_count'][0:5].sum()
print('Top 5 Authors Number:', topn_number)
Top 5 Authors Number: 72910
topn_number = tech_author_df.sort_values(by='total_count', ascending=False)['total_count'][0:30].sum()
print('Top 30 Authors Number:', topn_number)
Top 30 Authors Number: 113993
import matplotlib.pyplot as plt
import matplotlib.ticker as ticker

author_number_plot = tech_author_df.sort_values(by='total_count', ascending=False).head(50)

plt.rcParams["figure.figsize"] = (5,2)
plt.rcParams["figure.dpi"] = 300

# create a stacked bar chart
ax = author_number_plot[['author','comments_count', 'subs_count']].plot(kind='bar', stacked=True, x='author', figsize=(10, 6))
ax.set_ylabel('Total Number')


# customize the chart
plt.title('Submission and Comment Number by Author on r/technology')
plt.legend(['Comments', 'Submissions'], loc='upper right')

plt.xticks(rotation=45, fontsize=5, ha='right')

plt.axvline(x=4.5, color='red', ls='--')
ax.text(4.8, 20000, "20% of total number", color='red', rotation=90)

plt.axvline(x=29.5, color='darkred', ls='--')
ax.text(29.8, 20000, "30% of total number", color='red', rotation=90)


ax.yaxis.set_major_formatter(ticker.FuncFormatter(lambda x, p: format(int(x), ',')))

plt.show()

Submission Count

total_number = tech_author_df['subs_count'].sum()
print('Total Number:', total_number)
print('38% Number:', int(total_number*.38))
print('18% Number:', int(total_number* .18))
Total Number: 50713
38% Number: 19270
18% Number: 9128
topn_number = tech_author_df.sort_values(by='subs_count', ascending=False)['subs_count'][0:5].sum()
print('Top 5 Authors Number:', topn_number)
Top 5 Authors Number: 9076
topn_number = tech_author_df.sort_values(by='subs_count', ascending=False)['subs_count'][0:30].sum()
print('Top 30 Authors Number:', topn_number)
Top 30 Authors Number: 19163
author_number_plot = tech_author_df.sort_values(by='subs_count', ascending=False).head(50)

plt.rcParams["figure.figsize"] = (5,2)
plt.rcParams["figure.dpi"] = 300

# create a stacked bar chart
ax = author_number_plot[['author','subs_count']].plot(kind='bar', stacked=True, x='author', figsize=(10, 6))
ax.set_ylabel('Total Number')


# customize the chart
plt.title('Submission Number by Author on r/technology')
plt.legend(['Submissions'], loc='upper right')

plt.xticks(rotation=45, fontsize=5, ha='right')

plt.axvline(x=4.5, color='red', ls='--')
ax.text(4.8, 1500, "18% of total number", color='red', rotation=90)

plt.axvline(x=29.5, color='darkred', ls='--')
ax.text(29.8, 1500, "38% of total number", color='red', rotation=90)


ax.yaxis.set_major_formatter(ticker.FuncFormatter(lambda x, p: format(int(x), ',')))

plt.show()

Comment Count

total_number = tech_author_df['comments_count'].sum()
print('Total Number:', total_number)
print('34% Number:', int(total_number*.34))
print('23% Number:', int(total_number* .23))
Total Number: 318646
34% Number: 108339
23% Number: 73288
topn_number = tech_author_df.sort_values(by='comments_count', ascending=False)['comments_count'][0:5].sum()
print('Top 5 Authors Number:', topn_number)
Top 5 Authors Number: 72767
topn_number = tech_author_df.sort_values(by='comments_count', ascending=False)['comments_count'][0:30].sum()
print('Top 30 Authors Number:', topn_number)
Top 30 Authors Number: 107456
author_number_plot = tech_author_df.sort_values(by='comments_count', ascending=False).head(50)

plt.rcParams["figure.figsize"] = (5,2)
plt.rcParams["figure.dpi"] = 300

# create a stacked bar chart
ax = author_number_plot[['author','comments_count']].plot(kind='bar', stacked=True, x='author', figsize=(10, 6))
ax.set_ylabel('Total Number')


# customize the chart
plt.title('Comment Number by Author on r/technology')
plt.legend(['Comments'], loc='upper right')

plt.xticks(rotation=45, fontsize=5, ha='right')

plt.axvline(x=4.5, color='red', ls='--')
ax.text(4.8, 20000, "23% of total number", color='red', rotation=90)

plt.axvline(x=29.5, color='darkred', ls='--')
ax.text(29.8, 20000, "34% of total number", color='red', rotation=90)


ax.yaxis.set_major_formatter(ticker.FuncFormatter(lambda x, p: format(int(x), ',')))

plt.show()

r/Futurology

futu_sub_author_count = future_submissions.groupBy('author').agg(count("author").alias("subs_count")).sort(desc('subs_count'))
futu_com_author_count = future_comments.groupBy('author').agg(count("author").alias("comments_count")).sort(desc('comments_count'))
futu_sub_author_count.show(10)
futu_com_author_count.show(10)
                                                                                [Stage 29:=====================================================>(275 + 1) / 276]                                                                                
+-----------------+----------+
|           author|subs_count|
+-----------------+----------+
|        [deleted]|      8057|
|         Gari_305|      1587|
|        izumi3682|      1146|
|QuantumThinkology|       748|
|       lughnasadh|       662|
|          Sorin61|       622|
|           speckz|       570|
|   Dr_Singularity|       496|
|        kernals12|       392|
|     123designSRQ|       316|
+-----------------+----------+
only showing top 10 rows

+---------------+--------------+
|         author|comments_count|
+---------------+--------------+
|      [deleted]|        600671|
|  FuturologyBot|         11926|
|          Surur|          5405|
|  AutoModerator|          5036|
|   StarChild413|          2634|
|  OliverSparrow|          2406|
|   ValyrianJedi|          2264|
|    mhornberger|          2161|
|VitriolicViolet|          1969|
|      kernals12|          1867|
+---------------+--------------+
only showing top 10 rows
futu_author_count = futu_sub_author_count.join(futu_com_author_count, "author")
futu_author_count = futu_author_count.na.fill(0)
futu_author_df = futu_author_count.toPandas()
                                                                                
futu_author_df = futu_author_df[futu_author_df['author'] != '[deleted]']
futu_author_df = futu_author_df.set_index('author').astype(int)
futu_author_df['total_count'] = futu_author_df['subs_count'] + futu_author_df['comments_count']
futu_author_df = futu_author_df.reset_index()
futu_author_df.head()
author subs_count comments_count total_count
0 xopranaut 1 66 67
1 Sapotis 1 20 21
2 Yuli-Ban 3 122 125
3 redingerforcongress 73 503 576
4 Melodicmarc 1 53 54
futu_author_df.to_csv("Futurology_Author.csv",index=False)

Total Count

total_number = futu_author_df['total_count'].sum()
print('Total Number:', total_number)
print('28% Number:', int(total_number*.28))
print('11% Number:', int(total_number* .11))
Total Number: 169394
28% Number: 47430
11% Number: 18633
topn_number = futu_author_df.sort_values(by='total_count', ascending=False)['total_count'][0:5].sum()
print('Top 5 Authors Number:', topn_number)
Top 5 Authors Number: 18398
topn_number = futu_author_df.sort_values(by='total_count', ascending=False)['total_count'][0:30].sum()
print('Top 30 Authors Number:', topn_number)
Top 30 Authors Number: 46708
author_number_plot = futu_author_df.sort_values(by='total_count', ascending=False).head(50)

plt.rcParams["figure.figsize"] = (5,2)
plt.rcParams["figure.dpi"] = 300

# create a stacked bar chart
ax = author_number_plot[['author','comments_count', 'subs_count']].plot(kind='bar', stacked=True, x='author', figsize=(10, 6))
ax.set_ylabel('Total Number')


# customize the chart
plt.title('Submission and Comment Number by Author on r/Futurology')
plt.legend(['Comments', 'Submissions'], loc='upper right')

plt.xticks(rotation=45, fontsize=5, ha='right')

plt.axvline(x=4.5, color='red', ls='--')
ax.text(4.8, 3500, "11% of total number", color='red', rotation=90)

plt.axvline(x=29.5, color='darkred', ls='--')
ax.text(29.8, 3500, "28% of total number", color='red', rotation=90)


ax.yaxis.set_major_formatter(ticker.FuncFormatter(lambda x, p: format(int(x), ',')))

plt.show()

Submission Count

total_number = futu_author_df['subs_count'].sum()
print('Total Number:', total_number)
print('41% Number:', int(total_number*.41))
print('22% Number:', int(total_number* .22))
Total Number: 21943
41% Number: 8996
22% Number: 4827
topn_number = futu_author_df.sort_values(by='subs_count', ascending=False)['subs_count'][0:5].sum()
print('Top 5 Authors Number:', topn_number)
Top 5 Authors Number: 4765
topn_number = futu_author_df.sort_values(by='subs_count', ascending=False)['subs_count'][0:30].sum()
print('Top 30 Authors Number:', topn_number)
Top 30 Authors Number: 9018
author_number_plot = futu_author_df.sort_values(by='subs_count', ascending=False).head(50)

plt.rcParams["figure.figsize"] = (5,2)
plt.rcParams["figure.dpi"] = 300

# create a stacked bar chart
ax = author_number_plot[['author','subs_count']].plot(kind='bar', stacked=True, x='author', figsize=(10, 6))
ax.set_ylabel('Total Number')


# customize the chart
plt.title('Submission Number by Author on r/Futurology')
plt.legend(['Submissions'], loc='upper right')

plt.xticks(rotation=45, fontsize=5, ha='right')

plt.axvline(x=4.5, color='red', ls='--')
ax.text(4.8, 1000, "22% of total number", color='red', rotation=90)

plt.axvline(x=29.5, color='darkred', ls='--')
ax.text(29.8, 1000, "41% of total number", color='red', rotation=90)


ax.yaxis.set_major_formatter(ticker.FuncFormatter(lambda x, p: format(int(x), ',')))

plt.show()

Comment Count

total_number = futu_author_df['comments_count'].sum()
print('Total Number:', total_number)
print('28% Number:', int(total_number*.28))
print('12% Number:', int(total_number* .12))
Total Number: 147451
28% Number: 41286
12% Number: 17694
topn_number = futu_author_df.sort_values(by='comments_count', ascending=False)['comments_count'][0:5].sum()
print('Top 5 Authors Number:', topn_number)
Top 5 Authors Number: 17642
topn_number = futu_author_df.sort_values(by='comments_count', ascending=False)['comments_count'][0:30].sum()
print('Top 30 Authors Number:', topn_number)
Top 30 Authors Number: 41553
author_number_plot = futu_author_df.sort_values(by='comments_count', ascending=False).head(50)

plt.rcParams["figure.figsize"] = (5,2)
plt.rcParams["figure.dpi"] = 300

# create a stacked bar chart
ax = author_number_plot[['author','comments_count']].plot(kind='bar', stacked=True, x='author', figsize=(10, 6))
ax.set_ylabel('Total Number')


# customize the chart
plt.title('Comment Number by Author on r/Futurology')
plt.legend(['Comments'], loc='upper right')

plt.xticks(rotation=45, fontsize=5, ha='right')

plt.axvline(x=4.5, color='red', ls='--')
ax.text(4.8, 3000, "12% of total number", color='red', rotation=90)

plt.axvline(x=29.5, color='darkred', ls='--')
ax.text(29.8, 3000, "28% of total number", color='red', rotation=90)


ax.yaxis.set_major_formatter(ticker.FuncFormatter(lambda x, p: format(int(x), ',')))

plt.show()

2. Analyzing Fluctuations in Technology Discourse Over Time

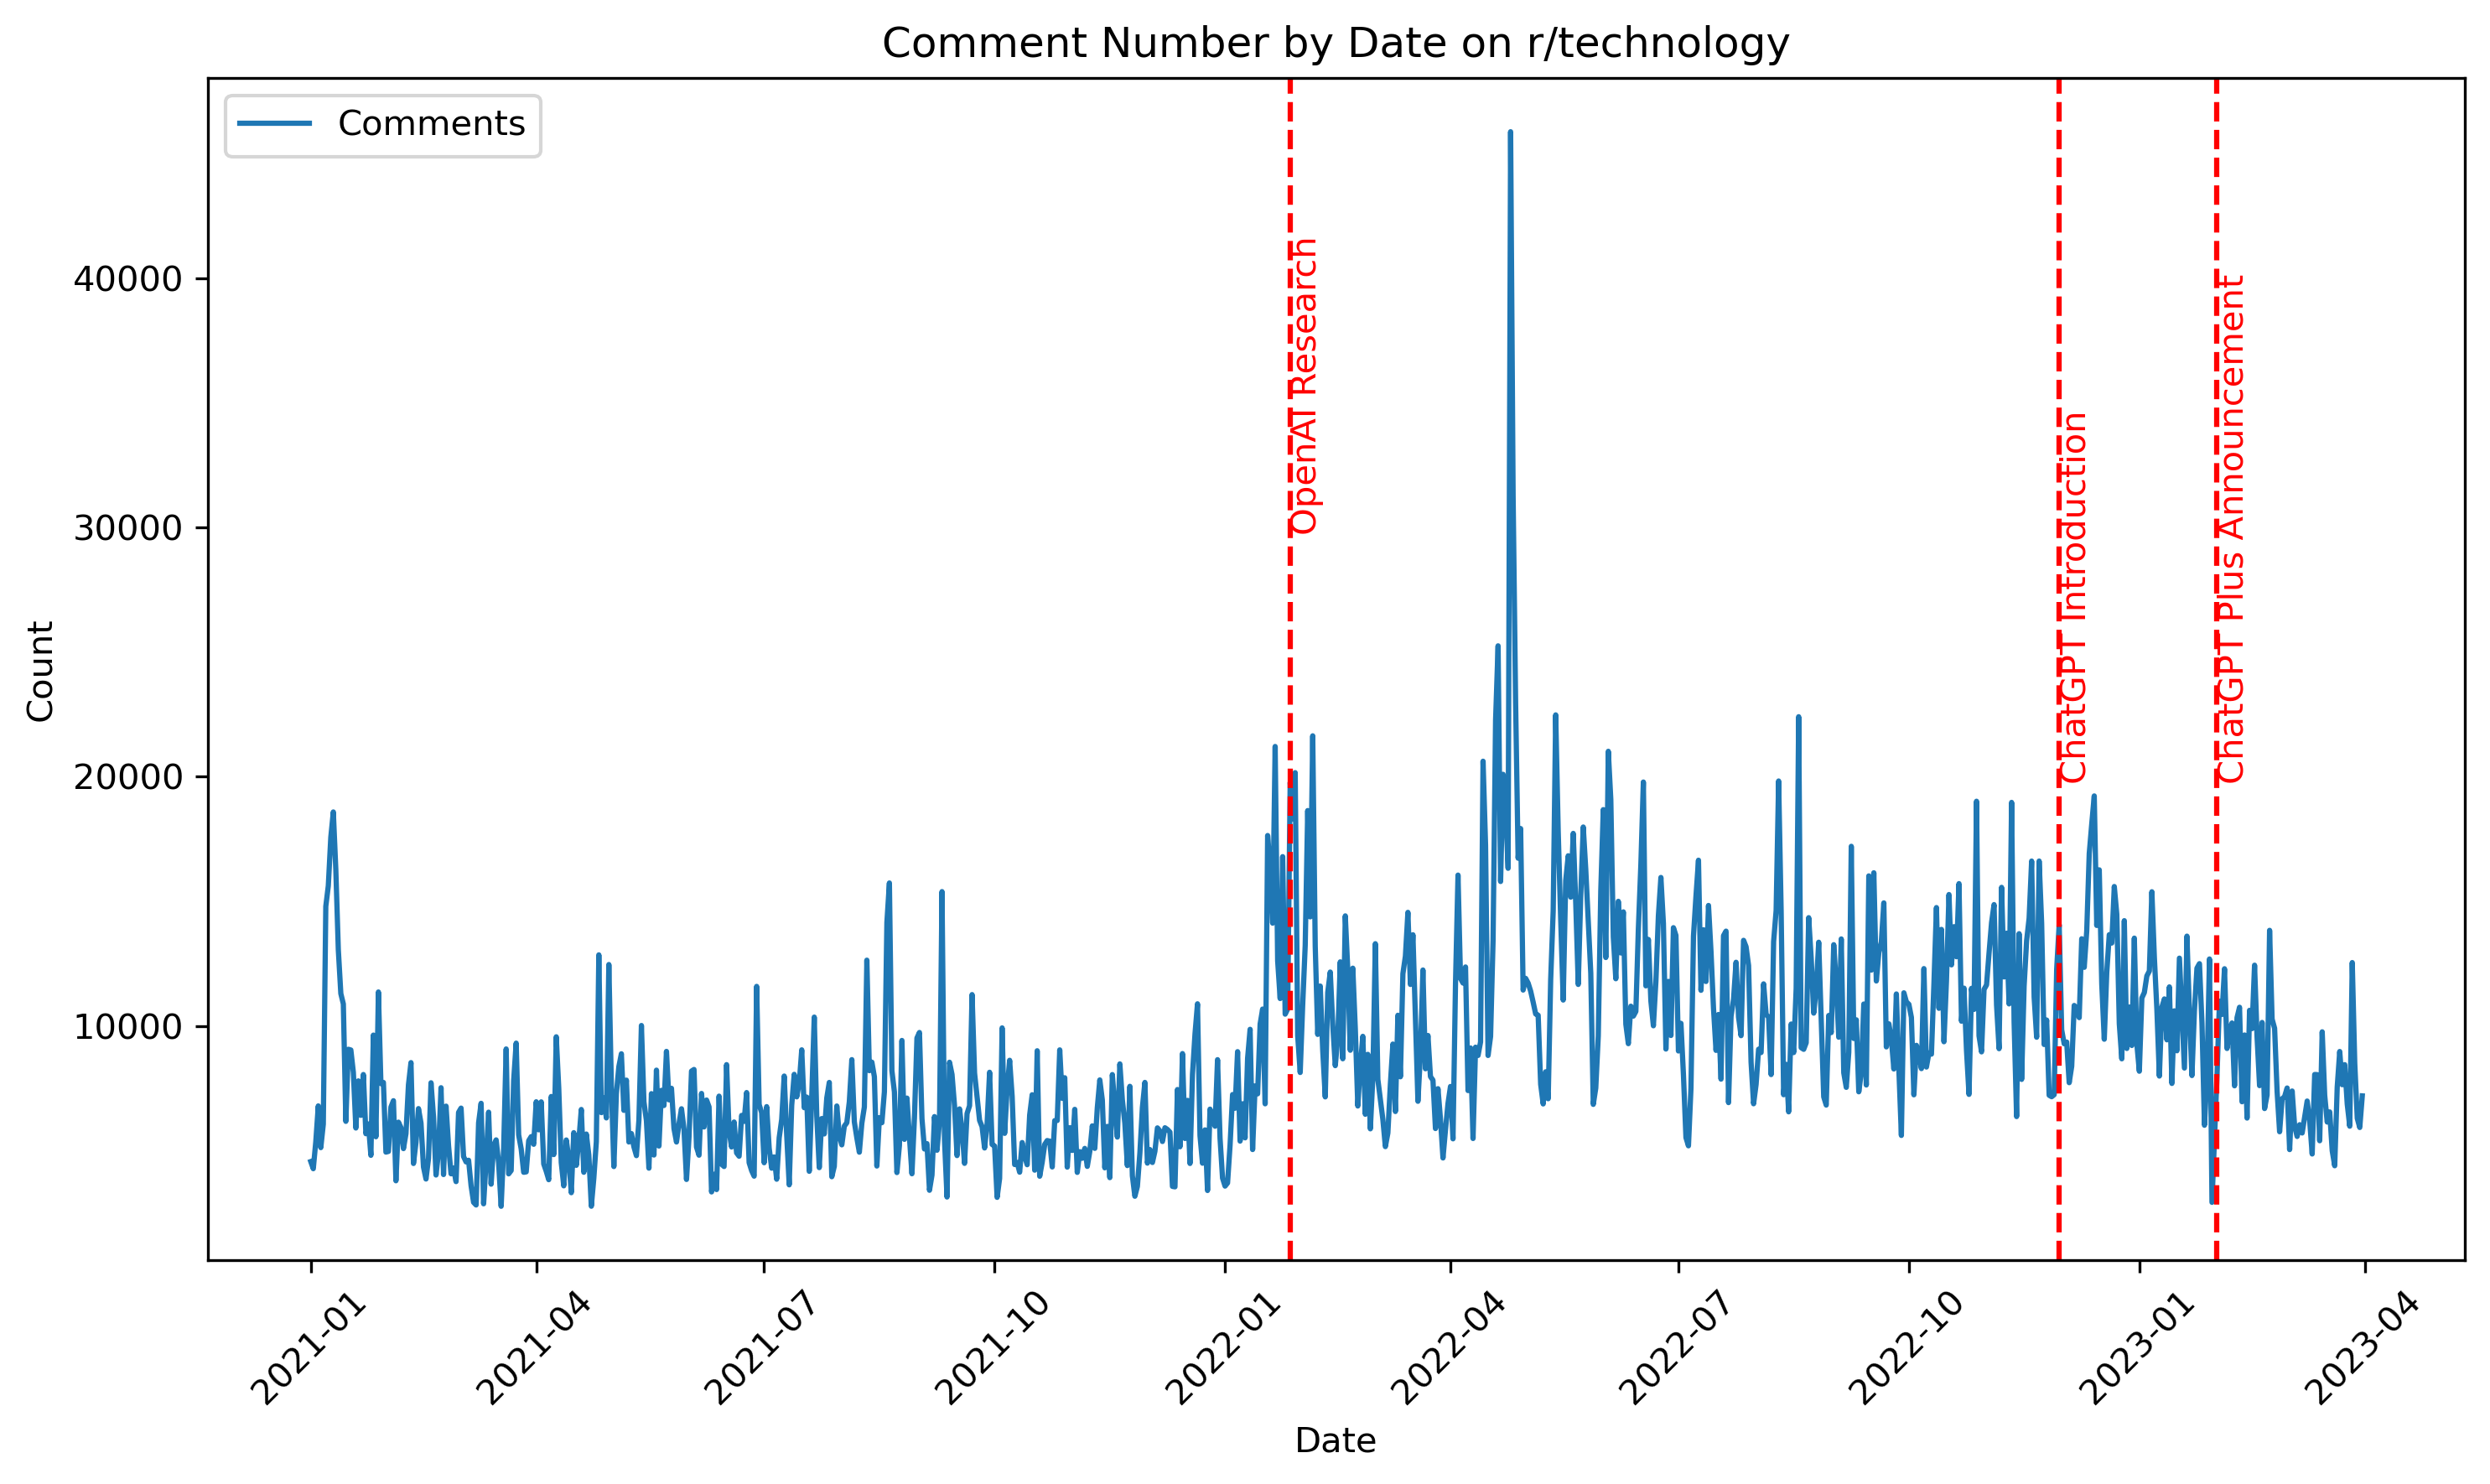
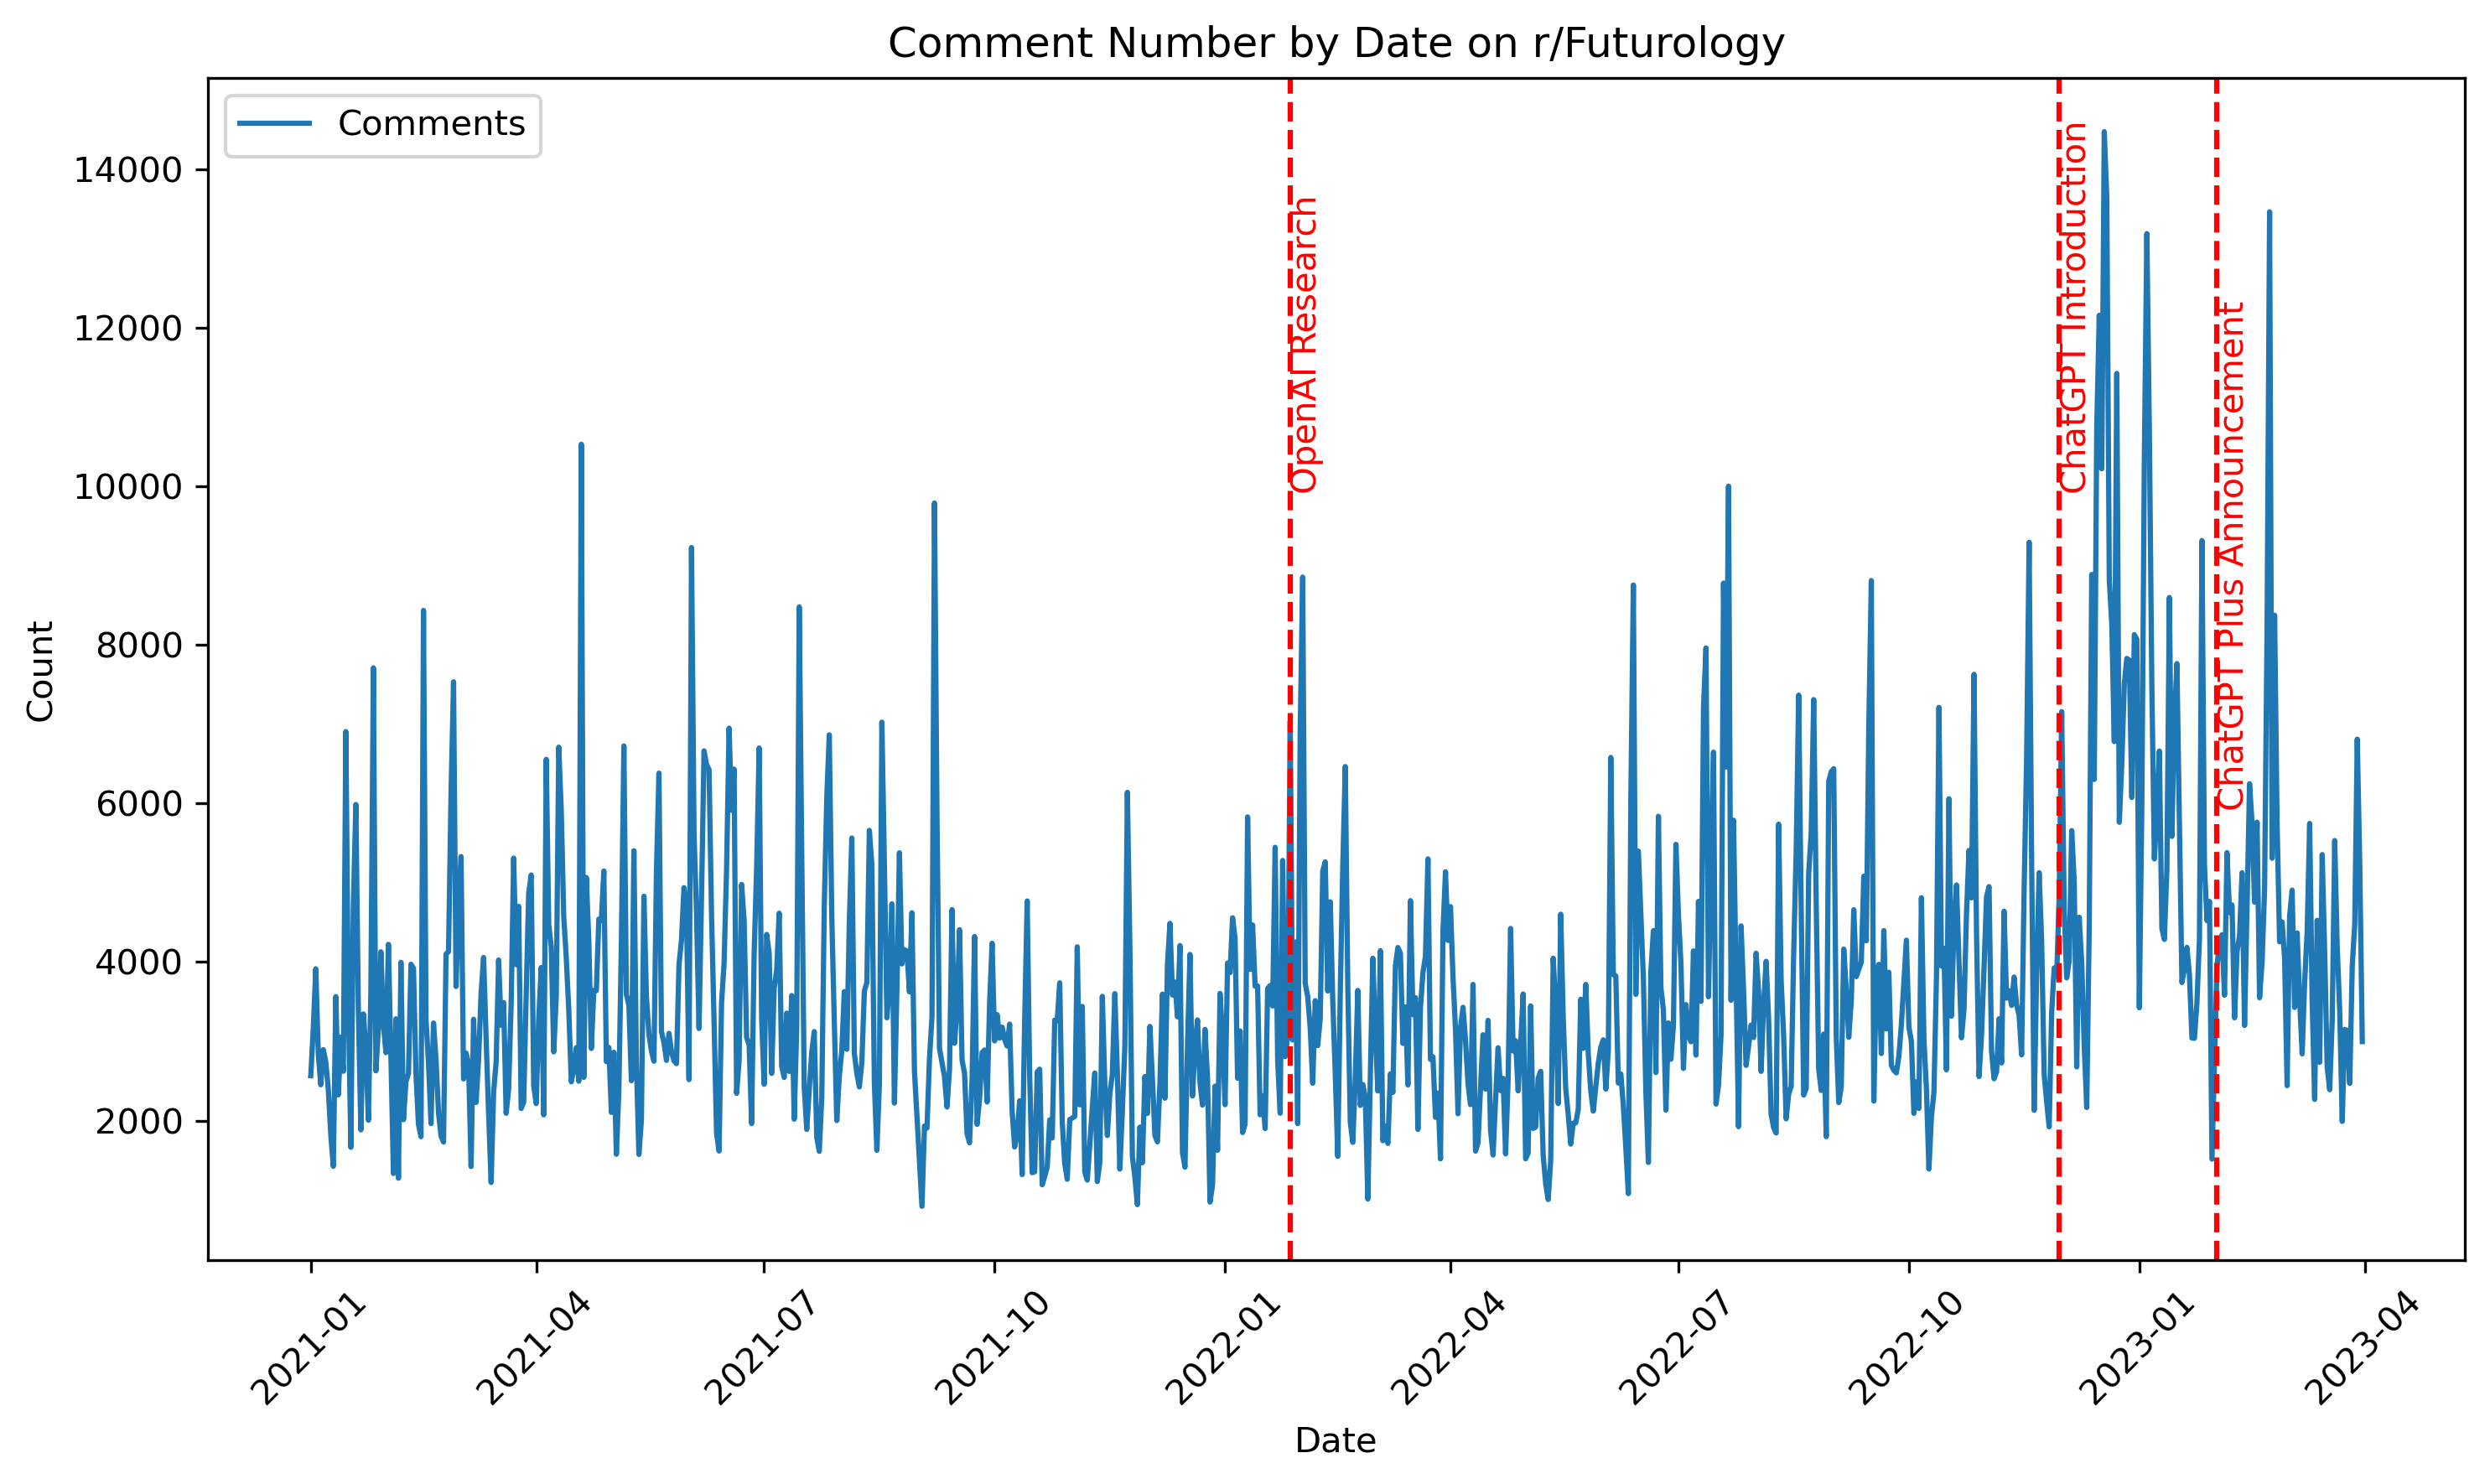
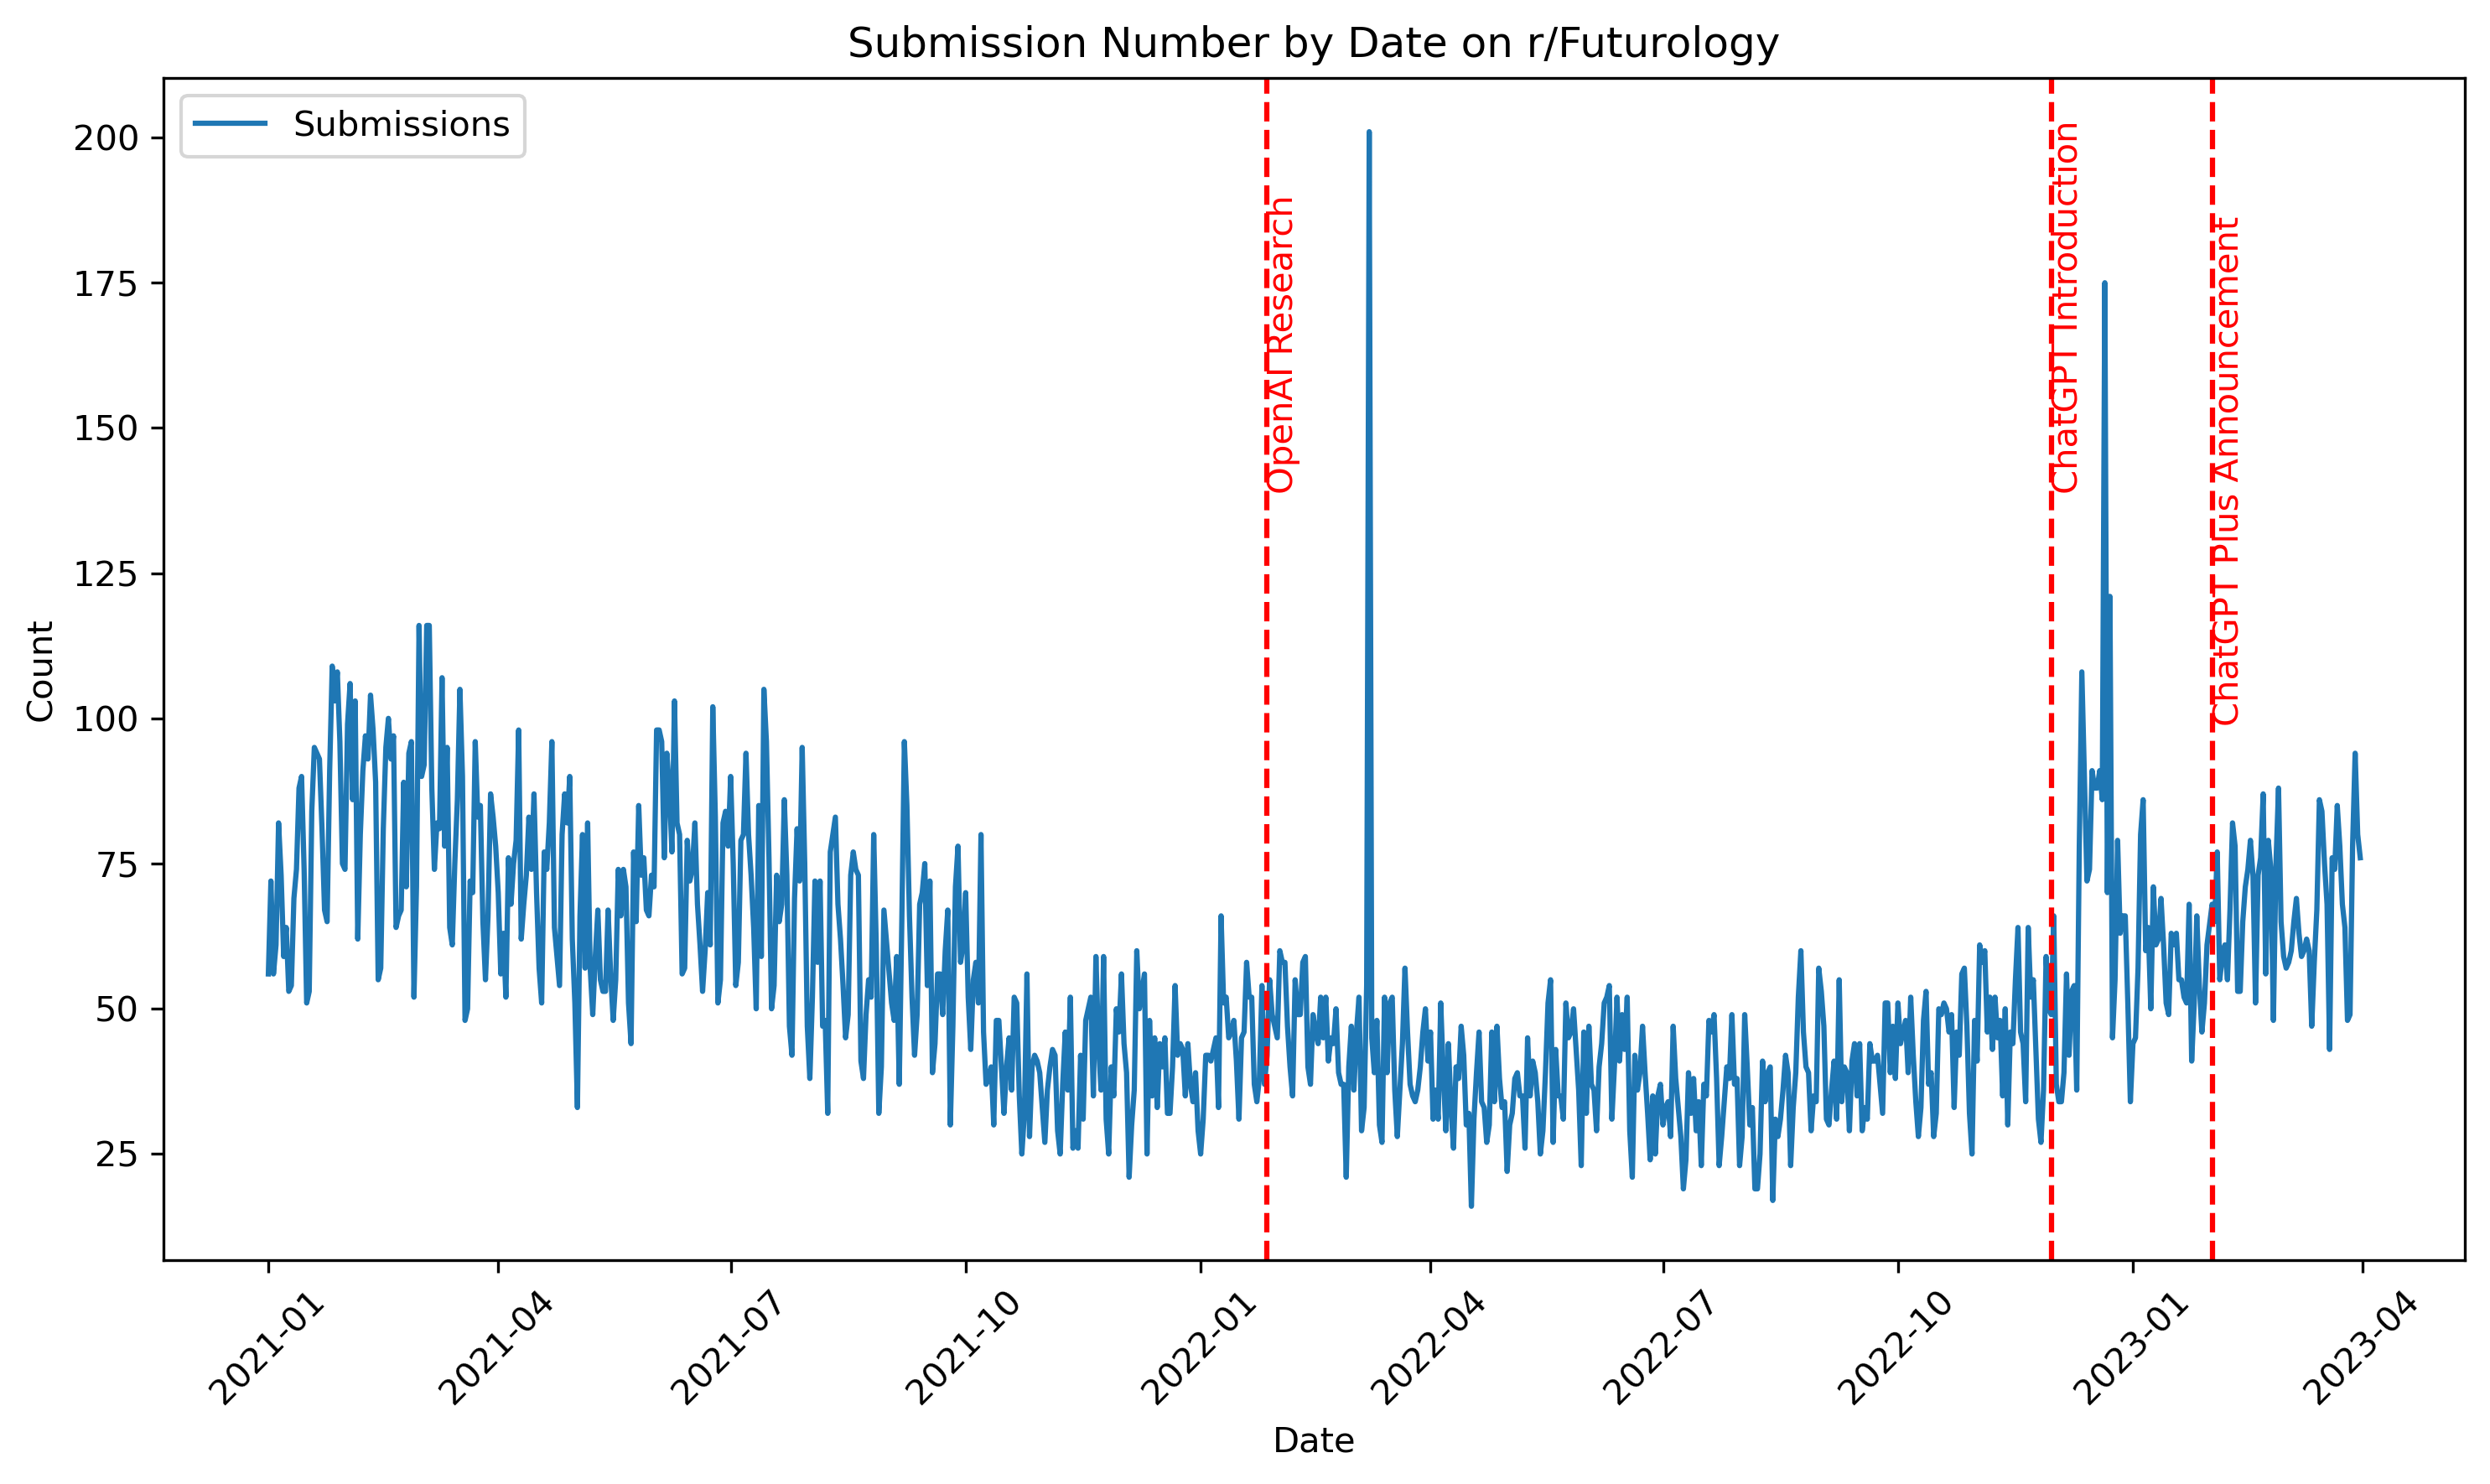
In our analysis, we delve into the evolving landscape of discussions surrounding technology, particularly focusing on pivotal events such as the rollout of GPT-3.5 and subsequent advancements like GPT-4. Our objective is to gauge their impact on the overall discourse within the realms of both r/Technology and r/Futurology. By scrutinizing the patterns of engagement—encompassing both submissions and comments—across various time frames, we aim to unearth trends in the volume and intensity of conversations concerning technology among community members. This inquiry seeks to provide valuable insights into the dynamics of public discourse and its evolution over time in the context of technological developments.

from pyspark.sql.functions import *
tech_sub_date_count = technology_submissions.groupBy('created_date').agg(count("created_date")\
                                                                         .alias("subs_count")).sort(desc('subs_count'))
tech_com_date_count = technology_comments.groupBy('created_date').agg(count("created_date")\
                                                                      .alias("comments_count")).sort(desc('comments_count'))
futu_sub_date_count = future_submissions.groupBy('created_date').agg(count("created_date")\
                                                                         .alias("subs_count")).sort(desc('subs_count'))
futu_com_date_count = future_comments.groupBy('created_date').agg(count("created_date")\
                                                                      .alias("comments_count")).sort(desc('comments_count'))
tech_sub_date_count.show(10)
[Stage 18:======================================================>(99 + 1) / 100]                                                                                
+------------+----------+
|created_date|subs_count|
+------------+----------+
|  2021-02-11|       803|
|  2021-02-23|       787|
|  2021-02-24|       785|
|  2021-02-22|       761|
|  2021-01-21|       751|
|  2021-02-17|       737|
|  2021-01-27|       736|
|  2021-03-10|       717|
|  2021-02-12|       708|
|  2021-01-26|       701|
+------------+----------+
only showing top 10 rows
tech_date_count = tech_sub_date_count.join(tech_com_date_count, "created_date")
tech_date_count = tech_date_count.na.fill(0)
tech_date_df = tech_date_count.toPandas()
                                                                                
tech_date_df.head()
created_date subs_count comments_count
0 2021-12-23 185 4496
1 2021-02-18 372 7723
2 2022-09-03 130 9551
3 2022-11-23 204 14123
4 2021-08-06 210 6156
tech_date_df.to_csv("Technology_date.csv",index=False)
futu_date_count = futu_sub_date_count.join(futu_com_date_count, "created_date")
futu_date_count = futu_date_count.na.fill(0)
futu_date_df = futu_date_count.toPandas()
                                                                                
futu_date_df.head()
created_date subs_count comments_count
0 2021-12-23 42 2196
1 2021-02-18 93 1963
2 2022-09-03 31 2227
3 2022-11-23 55 4260
4 2021-08-06 47 2849
futu_date_df.to_csv("Futurology_date.csv",index=False)
import matplotlib.pyplot as plt
import pandas as pd

tech_date_df1 = tech_date_df.reset_index()
# Convert 'created_date' column to datetime
tech_date_df1['created_date'] = pd.to_datetime(tech_date_df1['created_date'])

# Sort the DataFrame by 'created_date' column
tech_date_df1 = tech_date_df1.sort_values(by='created_date')

plt.figure(figsize=(10, 6))
plt.rcParams["figure.dpi"] = 300

# Plot submissions
#plt.plot(tech_date_df1['created_date'], tech_date_df1['subs_count'], label='Submissions')

# Plot comments
plt.plot(tech_date_df1['created_date'], tech_date_df1['comments_count'], label='Comments')

# Add vertical lines for significant events
plt.axvline(x=pd.to_datetime('2022-01-27'), color='red', linestyle='--')
plt.text(pd.to_datetime('2022-01-27'), 30000, "OpenAI Research", color='red', rotation=90)

plt.axvline(x=pd.to_datetime('2022-11-30'), color='red', linestyle='--')
plt.text(pd.to_datetime('2022-11-30'), 20000, "ChatGPT Introduction", color='red', rotation=90)

plt.axvline(x=pd.to_datetime('2023-02-01'), color='red', linestyle='--')
plt.text(pd.to_datetime('2023-02-01'), 20000, "ChatGPT Plus Announcement", color='red', rotation=90)

# Add labels, title, and legend
plt.xlabel('Date')
plt.ylabel('Count')
plt.title('Comment Number by Date on r/technology')
plt.legend()

# Show plot
plt.xticks(rotation=45)
plt.tight_layout()
plt.show()

plt.figure(figsize=(10, 6))
plt.rcParams["figure.dpi"] = 300

# Plot submissions
plt.plot(tech_date_df1['created_date'], tech_date_df1['subs_count'], label='Submissions')

# Add vertical lines for significant events
plt.axvline(x=pd.to_datetime('2022-01-27'), color='red', linestyle='--')
plt.text(pd.to_datetime('2022-01-27'), 400, "OpenAI Research", color='red', rotation=90)

plt.axvline(x=pd.to_datetime('2022-11-30'), color='red', linestyle='--')
plt.text(pd.to_datetime('2022-11-30'), 400, "ChatGPT Introduction", color='red', rotation=90)

plt.axvline(x=pd.to_datetime('2023-02-01'), color='red', linestyle='--')
plt.text(pd.to_datetime('2023-02-01'), 400, "ChatGPT Plus Announcement", color='red', rotation=90)

# Add labels, title, and legend
plt.xlabel('Date')
plt.ylabel('Count')
plt.title('Submission Number by Date on r/technology')
plt.legend()

# Show plot
plt.xticks(rotation=45)
plt.tight_layout()
plt.show()

futu_date_df1 = futu_date_df.reset_index()
# Convert 'created_date' column to datetime
futu_date_df1['created_date'] = pd.to_datetime(futu_date_df1['created_date'])

# Sort the DataFrame by 'created_date' column
futu_date_df1 = futu_date_df1.sort_values(by='created_date')

plt.figure(figsize=(10, 6))
plt.rcParams["figure.dpi"] = 300

# Plot submissions
#plt.plot(tech_date_df1['created_date'], tech_date_df1['subs_count'], label='Submissions')

# Plot comments
plt.plot(futu_date_df1['created_date'], futu_date_df1['comments_count'], label='Comments')

# Add vertical lines for significant events
plt.axvline(x=pd.to_datetime('2022-01-27'), color='red', linestyle='--')
plt.text(pd.to_datetime('2022-01-27'), 10000, "OpenAI Research", color='red', rotation=90)

plt.axvline(x=pd.to_datetime('2022-11-30'), color='red', linestyle='--')
plt.text(pd.to_datetime('2022-11-30'), 10000, "ChatGPT Introduction", color='red', rotation=90)

plt.axvline(x=pd.to_datetime('2023-02-01'), color='red', linestyle='--')
plt.text(pd.to_datetime('2023-02-01'), 6000, "ChatGPT Plus Announcement", color='red', rotation=90)

# Add labels, title, and legend
plt.xlabel('Date')
plt.ylabel('Count')
plt.title('Comment Number by Date on r/Futurology')
plt.legend()

# Show plot
plt.xticks(rotation=45)
plt.tight_layout()
plt.show()

plt.figure(figsize=(10, 6))
plt.rcParams["figure.dpi"] = 300

# Plot submissions
plt.plot(futu_date_df1['created_date'], futu_date_df1['subs_count'], label='Submissions')

# Add vertical lines for significant events
plt.axvline(x=pd.to_datetime('2022-01-27'), color='red', linestyle='--')
plt.text(pd.to_datetime('2022-01-27'), 140, "OpenAI Research", color='red', rotation=90)

plt.axvline(x=pd.to_datetime('2022-11-30'), color='red', linestyle='--')
plt.text(pd.to_datetime('2022-11-30'), 140, "ChatGPT Introduction", color='red', rotation=90)

plt.axvline(x=pd.to_datetime('2023-02-01'), color='red', linestyle='--')
plt.text(pd.to_datetime('2023-02-01'), 100, "ChatGPT Plus Announcement", color='red', rotation=90)

# Add labels, title, and legend
plt.xlabel('Date')
plt.ylabel('Count')
plt.title('Submission Number by Date on r/Futurology')
plt.legend()

# Show plot
plt.xticks(rotation=45)
plt.tight_layout()
plt.show()

4. Exploring Technology Themes in r/news Subreddits

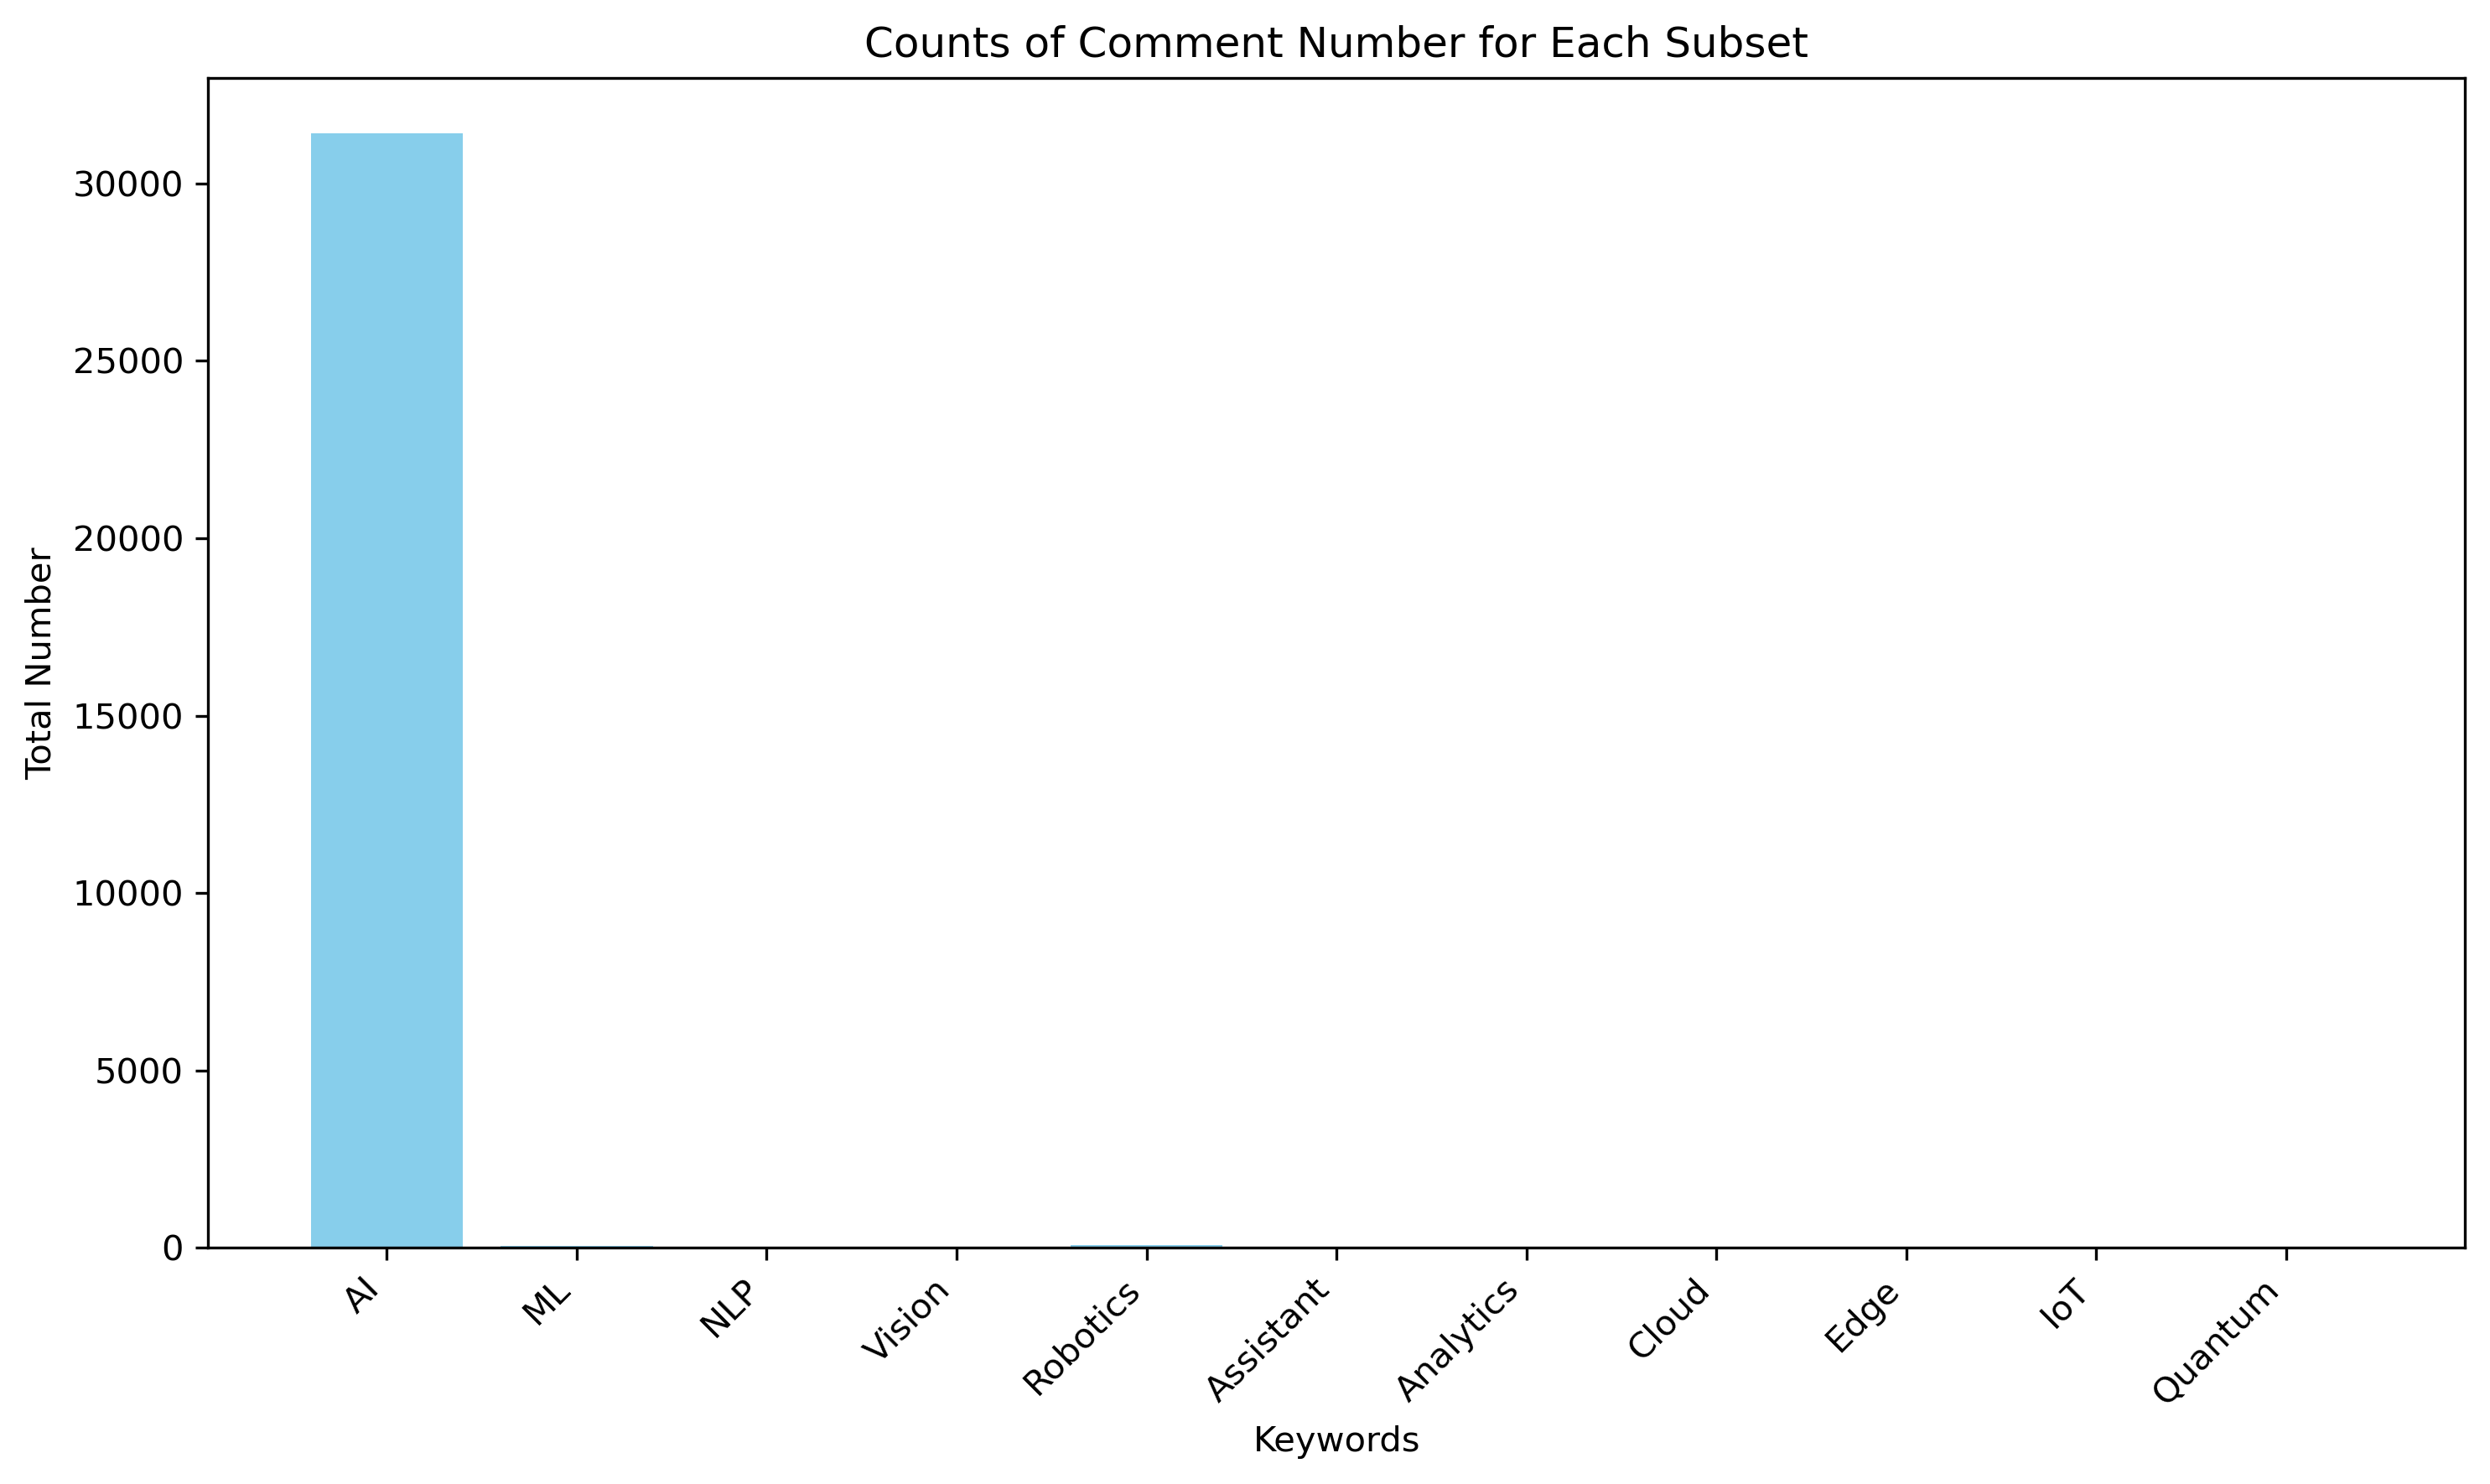
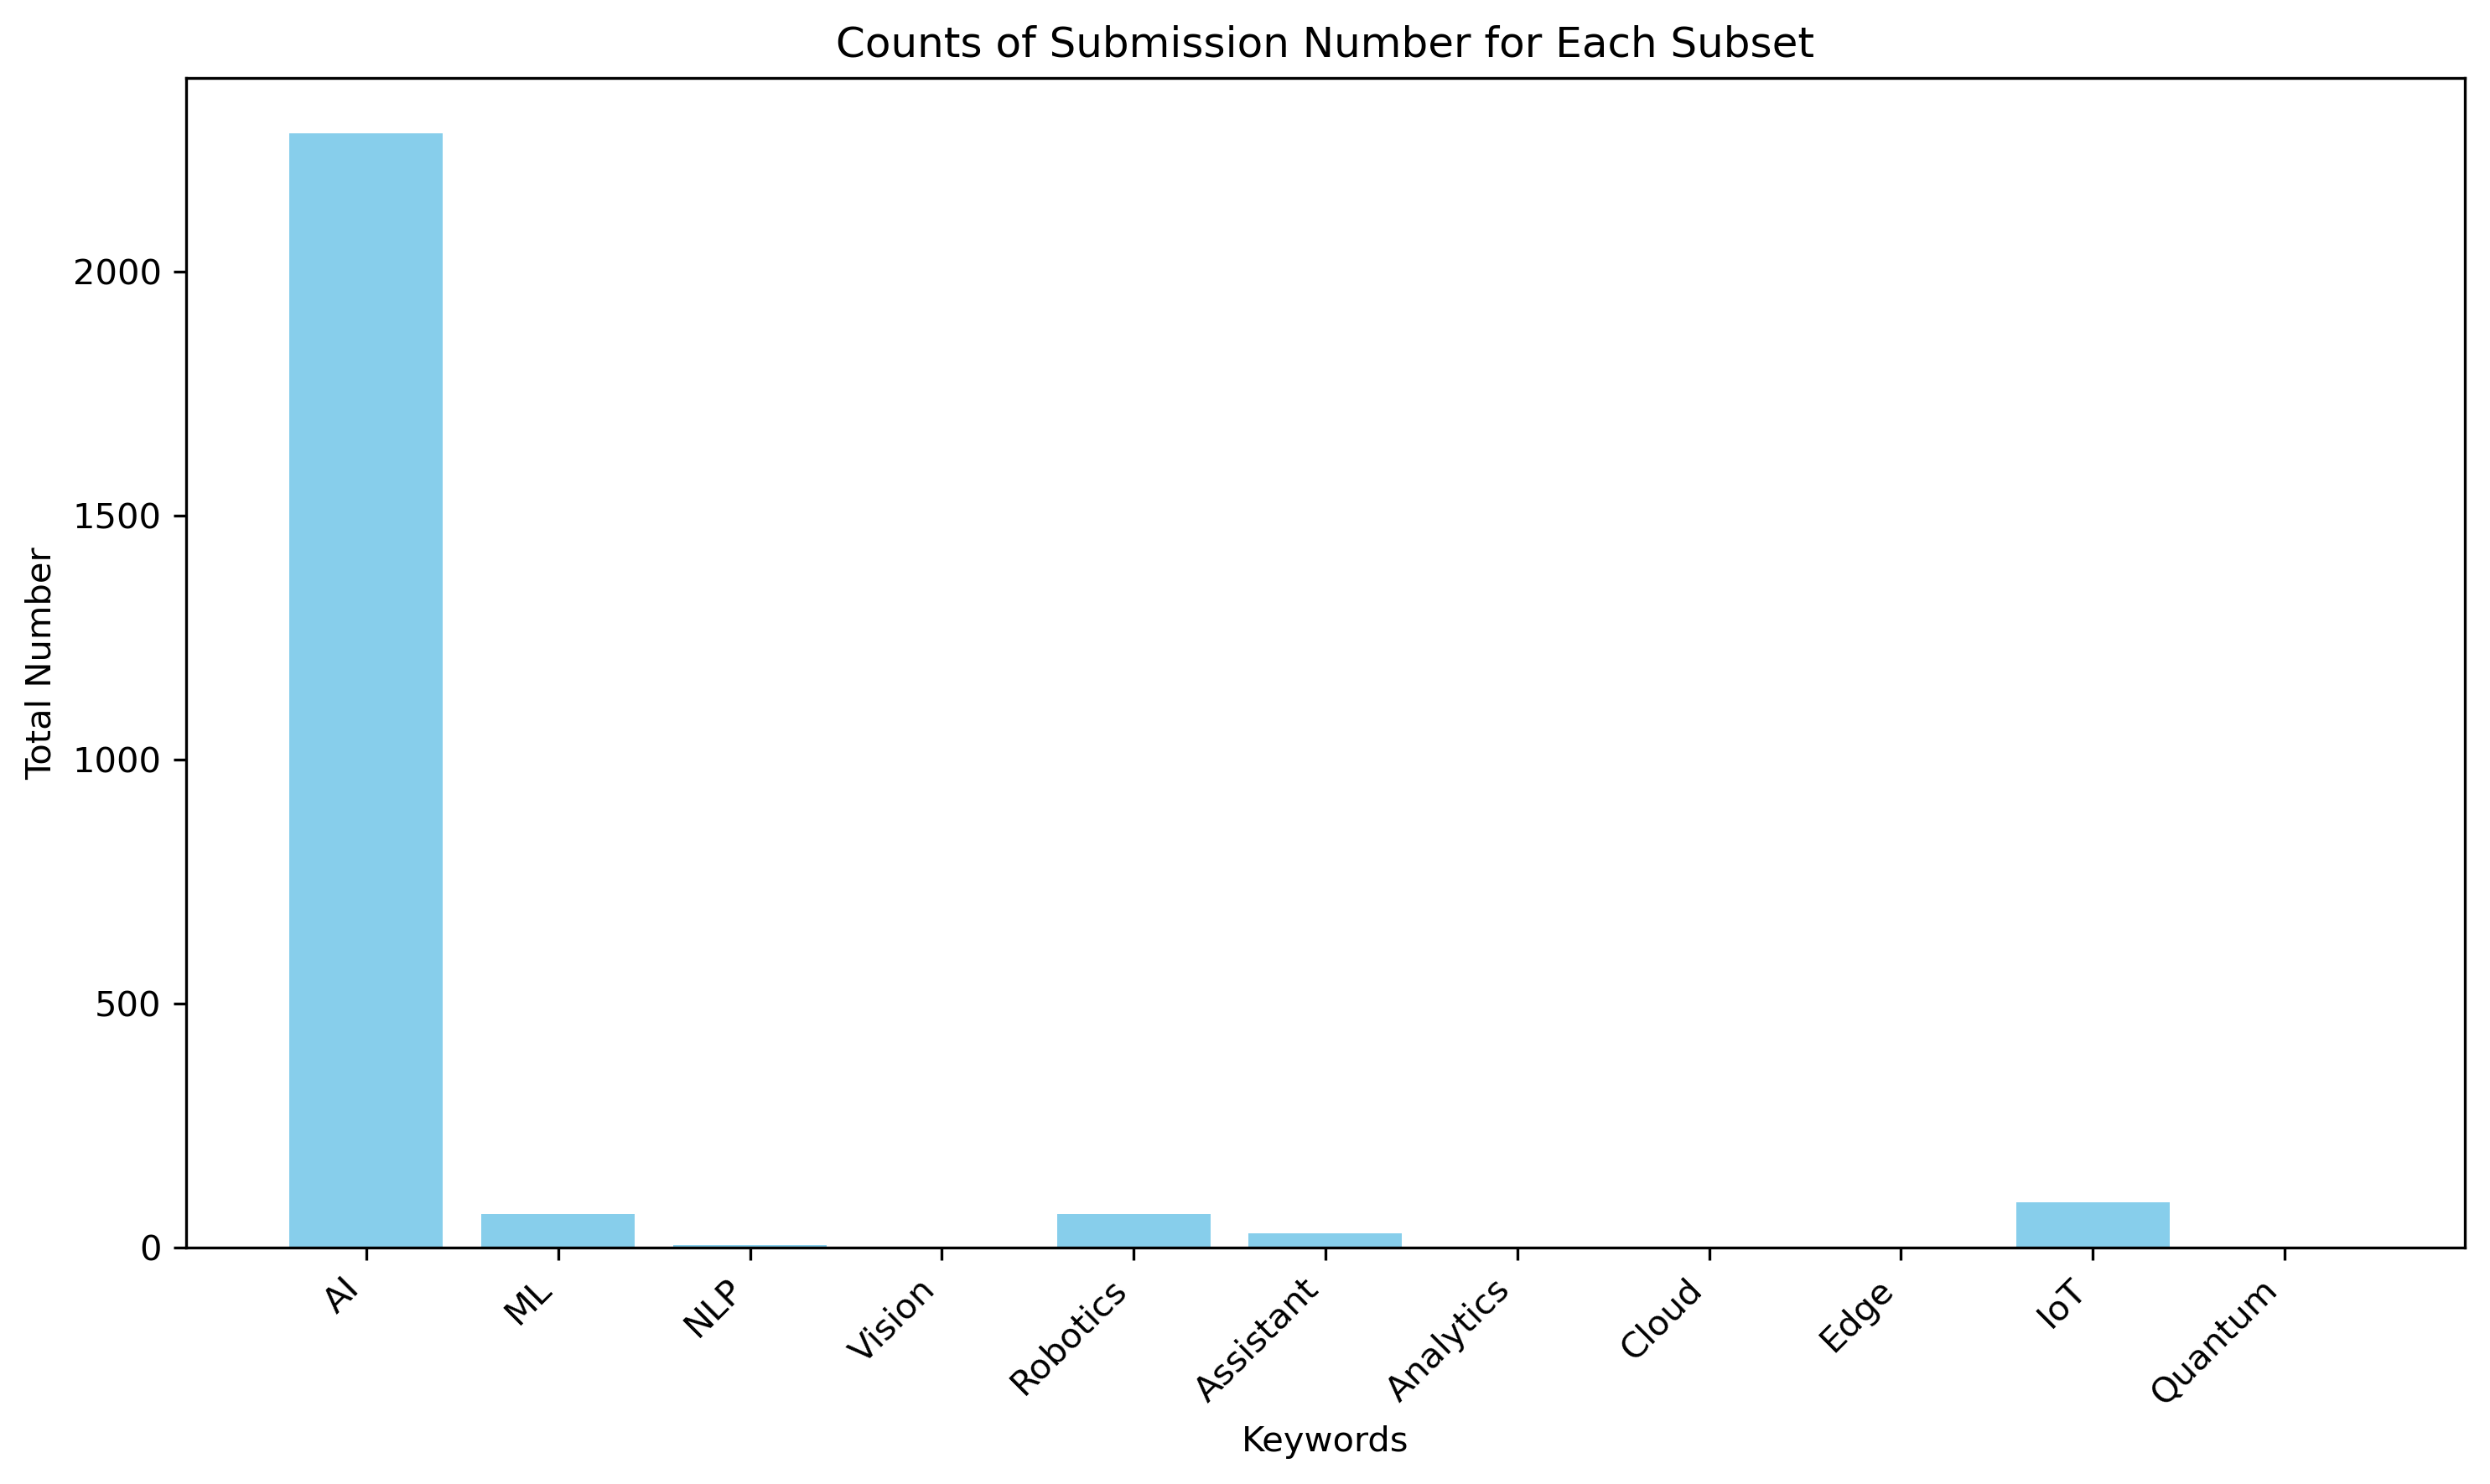
In this section, we embark on an investigation into various technological domains within the context of r/news subreddits. We meticulously examine eleven distinct thematic areas, including Artificial Intelligence (AI), Machine Learning (ML), Natural Language Processing (NLP), among others. Our objective is to scrutinize the distribution of both submissions and comments from January 2021 to March 2023, shedding light on the prominence of these technology-centric topics within the r/news community. Through this analysis, we aim to glean insights into the prevalence and engagement levels surrounding these specific technological themes within the broader news discourse.

ai_keywords = ['artificial intelligence', 'ai', 'chatgpt', 'gpt', 'openai', 'intelligence', 'machine intelligence', 'virtual intelligence']
ml_keywords = ['machine learning', 'ml', 'deep learning', 'neural networks', 'pattern recognition', 'predictive modeling', 'statistical learning']
nlp_keywords = ['natural language processing', 'nlp', 'large language model', 'language understanding', 'text analysis', 'speech recognition']
vision_keywords = ['computer vision', 'visual recognition', 'image processing', 'object detection', 'scene understanding']
robotics_keywords = ['robotics', 'autonomous vehicles', 'self-driving cars', 'robotic systems', 'automated vehicles']
assistant_keywords = ['virtual assistants', 'chatbots', 'conversation agents', 'automated helpers']
analytics_keywords = ['big data analytics', 'data analysis', 'data mining', 'data insights']
cloud_keywords = ['cloud computing', 'cloud services', 'cloud platforms', 'cloud infrastructure']
edge_keywords = ['edge computing', 'edge devices', 'edge analytics', 'edge networks']
iot_keywords = ['internet of things', 'iot', 'smart devices', 'connected devices']
quantum_keywords = ['quantum computing', 'quantum algorithms', 'quantum cryptography', 'quantum networks']
# Combine all into a single list
keywords = (
    ai_keywords + ml_keywords + nlp_keywords + vision_keywords + 
    robotics_keywords + assistant_keywords + 
    analytics_keywords + cloud_keywords + edge_keywords + 
    iot_keywords + quantum_keywords
)
from pyspark.sql.functions import *
# Remove punctuation and special characters from the body column
cleaned_news_comments = news_comments.withColumn("cleaned_body", regexp_replace(col("body"), "[^a-zA-Z0-9\\s]", ""))

# Lowercase the text in the cleaned_body column
cleaned_news_comments = cleaned_news_comments.withColumn("cleaned_body", lower(col("cleaned_body")))
# Remove punctuation and special characters from the body column
cleaned_news_submissions = news_submissions.withColumn("cleaned_body", regexp_replace(col("title"), "[^a-zA-Z0-9\\s]", ""))

# Lowercase the text in the cleaned_body column
cleaned_news_submissions = cleaned_news_submissions.withColumn("cleaned_body", lower(col("cleaned_body")))
cleaned_news_comments.select("body","cleaned_body").show(10)
+--------------------+--------------------+
|                body|        cleaned_body|
+--------------------+--------------------+
|           Why wait?|            why wait|
|The tweet is gone...|the tweet is gone...|
|You should probab...|you should probab...|
|You wouldn't be a...|you wouldnt be ab...|
|I believe the ter...|i believe the ter...|
|Peep the video I ...|peep the video i ...|
|He's sent a viole...|hes sent a violen...|
|As much as I woul...|as much as i woul...|
|Snurchy, i think ...|snurchy i think y...|
|I’m trying not to...|im trying not to ...|
+--------------------+--------------------+
only showing top 10 rows
cleaned_news_submissions.select("title","cleaned_body").show(10)
+--------------------+--------------------+
|               title|        cleaned_body|
+--------------------+--------------------+
|New Warp Drive Mo...|new warp drive mo...|
|UNICAL CES admiss...|unical ces admiss...|
|Attack on Asian W...|attack on asian w...|
|'Nomadland' wins ...|nomadland wins be...|
|دانلود آهنگ کردی ...|                    |
|Ireland to promot...|ireland to promot...|
|Newspaper Mistake...|newspaper mistake...|
|River Improvement...|river improvement...|
|HOW TO SELL WITH ...|how to sell with ...|
|PayPal will let U...|paypal will let u...|
+--------------------+--------------------+
only showing top 10 rows
                                                                                
# Filter news comments for technology topics
filtered_news_comments = cleaned_news_comments.filter(
    col('cleaned_body').rlike(r'\b' + r'\b|\b'.join(keywords) + r'\b')
)
print(f"shape of the filtered news comments dataframe is {filtered_news_comments.count():,}x{len(filtered_news_comments.columns)}") 
[Stage 18:=====================================================>(275 + 1) / 276]                                                                                
shape of the filtered news comments dataframe is 31,402x26
# Filter news comments for technology topics
filtered_news_submissions = cleaned_news_submissions.filter(
    col('cleaned_body').rlike(r'\b' + r'\b|\b'.join(keywords) + r'\b')
)
print(f"shape of the filtered news submissions dataframe is {filtered_news_submissions.count():,}x{len(filtered_news_submissions.columns)}") 
[Stage 5:=======================================================>(99 + 1) / 100]                                                                                
shape of the filtered news submissions dataframe is 2,700x71
# Define functions to check if any keywords are present in the cleaned_body column
def contains_ai(body):
    return any(word in body.split() for word in ai_keywords)

def contains_ml(body):
    return any(word in body.split() for word in ml_keywords)

def contains_nlp(body):
    return any(word in body.split() for word in nlp_keywords)

def contains_vision(body):
    return any(word in body.split() for word in vision_keywords)

def contains_robotics(body):
    return any(word in body.split() for word in robotics_keywords)

def contains_assistant(body):
    return any(word in body.split() for word in assistant_keywords)

def contains_analytics(body):
    return any(word in body.split() for word in analytics_keywords)

def contains_cloud(body):
    return any(word in body.split() for word in cloud_keywords)

def contains_edge(body):
    return any(word in body.split() for word in edge_keywords)

def contains_iot(body):
    return any(word in body.split() for word in iot_keywords)

def contains_quantum(body):
    return any(word in body.split() for word in quantum_keywords)
from pyspark.sql.types import BooleanType
# Define UDFs for the functions
contains_ai_udf = udf(contains_ai, BooleanType())
contains_ml_udf = udf(contains_ml, BooleanType())
contains_nlp_udf = udf(contains_nlp, BooleanType())
contains_vision_udf = udf(contains_vision, BooleanType())
contains_robotics_udf = udf(contains_robotics, BooleanType())
contains_assistant_udf = udf(contains_assistant, BooleanType())
contains_analytics_udf = udf(contains_analytics, BooleanType())
contains_cloud_udf = udf(contains_cloud, BooleanType())
contains_edge_udf = udf(contains_edge, BooleanType())
contains_iot_udf = udf(contains_iot, BooleanType())
contains_quantum_udf = udf(contains_quantum, BooleanType())
# Add dummy variables based on keywords
filtered_news_comments = filtered_news_comments.withColumn("contains_ai", contains_ai_udf(filtered_news_comments['cleaned_body']))
filtered_news_comments = filtered_news_comments.withColumn("contains_ml", contains_ml_udf(filtered_news_comments['cleaned_body']))
filtered_news_comments = filtered_news_comments.withColumn("contains_nlp", contains_nlp_udf(filtered_news_comments['cleaned_body']))
filtered_news_comments = filtered_news_comments.withColumn("contains_vision", contains_vision_udf(filtered_news_comments['cleaned_body']))
filtered_news_comments = filtered_news_comments.withColumn("contains_robotics", contains_robotics_udf(filtered_news_comments['cleaned_body']))
filtered_news_comments = filtered_news_comments.withColumn("contains_assistant", contains_assistant_udf(filtered_news_comments['cleaned_body']))
filtered_news_comments = filtered_news_comments.withColumn("contains_analytics", contains_analytics_udf(filtered_news_comments['cleaned_body']))
filtered_news_comments = filtered_news_comments.withColumn("contains_cloud", contains_cloud_udf(filtered_news_comments['cleaned_body']))
filtered_news_comments = filtered_news_comments.withColumn("contains_edge", contains_edge_udf(filtered_news_comments['cleaned_body']))
filtered_news_comments = filtered_news_comments.withColumn("contains_iot", contains_iot_udf(filtered_news_comments['cleaned_body']))
filtered_news_comments = filtered_news_comments.withColumn("contains_quantum", contains_quantum_udf(filtered_news_comments['cleaned_body']))

# Subset DataFrame based on keywords
#ai_comments = filtered_news_comments.filter(col("contains_ai"))
#ml_comments = filtered_news_comments.filter(col("contains_ml"))
#nlp_comments = filtered_news_comments.filter(col("contains_nlp"))
#vision_comments = filtered_news_comments.filter(col("contains_vision"))
#robotics_comments = filtered_news_comments.filter(col("contains_robotics"))
#assistant_comments = filtered_news_comments.filter(col("contains_assistant"))
#analytics_comments = filtered_news_comments.filter(col("contains_analytics"))
#cloud_comments = filtered_news_comments.filter(col("contains_cloud"))
#edge_comments = filtered_news_comments.filter(col("contains_edge"))
#iot_comments = filtered_news_comments.filter(col("contains_iot"))
#quantum_comments = filtered_news_comments.filter(col("contains_quantum"))
# Add dummy variables based on keywords
filtered_news_submissions = filtered_news_submissions.withColumn("contains_ai", contains_ai_udf(filtered_news_submissions['cleaned_body']))
filtered_news_submissions = filtered_news_submissions.withColumn("contains_ml", contains_ml_udf(filtered_news_submissions['cleaned_body']))
filtered_news_submissions = filtered_news_submissions.withColumn("contains_nlp", contains_nlp_udf(filtered_news_submissions['cleaned_body']))
filtered_news_submissions = filtered_news_submissions.withColumn("contains_vision", contains_vision_udf(filtered_news_submissions['cleaned_body']))
filtered_news_submissions = filtered_news_submissions.withColumn("contains_robotics", contains_robotics_udf(filtered_news_submissions['cleaned_body']))
filtered_news_submissions = filtered_news_submissions.withColumn("contains_assistant", contains_assistant_udf(filtered_news_submissions['cleaned_body']))
filtered_news_submissions = filtered_news_submissions.withColumn("contains_analytics", contains_analytics_udf(filtered_news_submissions['cleaned_body']))
filtered_news_submissions = filtered_news_submissions.withColumn("contains_cloud", contains_cloud_udf(filtered_news_submissions['cleaned_body']))
filtered_news_submissions = filtered_news_submissions.withColumn("contains_edge", contains_edge_udf(filtered_news_submissions['cleaned_body']))
filtered_news_submissions = filtered_news_submissions.withColumn("contains_iot", contains_iot_udf(filtered_news_submissions['cleaned_body']))
filtered_news_submissions = filtered_news_submissions.withColumn("contains_quantum", contains_quantum_udf(filtered_news_submissions['cleaned_body']))
# Group by and aggregate to count true values in each column
subset_counts = (
    filtered_news_comments
    .agg(
        sum(col("contains_ai").cast("integer")).alias("ai_count"),
        sum(col("contains_ml").cast("integer")).alias("ml_count"),
        sum(col("contains_nlp").cast("integer")).alias("nlp_count"),
        sum(col("contains_vision").cast("integer")).alias("vision_count"),
        sum(col("contains_robotics").cast("integer")).alias("robotics_count"),
        sum(col("contains_assistant").cast("integer")).alias("assistant_count"),
        sum(col("contains_analytics").cast("integer")).alias("analytics_count"),
        sum(col("contains_cloud").cast("integer")).alias("cloud_count"),
        sum(col("contains_edge").cast("integer")).alias("edge_count"),
        sum(col("contains_iot").cast("integer")).alias("iot_count"),
        sum(col("contains_quantum").cast("integer")).alias("quantum_count")
    ))
subset_counts.show()
[Stage 34:=====================================================>(275 + 1) / 276]                                                                                
+--------+--------+---------+------------+--------------+---------------+---------------+-----------+----------+---------+-------------+
|ai_count|ml_count|nlp_count|vision_count|robotics_count|assistant_count|analytics_count|cloud_count|edge_count|iot_count|quantum_count|
+--------+--------+---------+------------+--------------+---------------+---------------+-----------+----------+---------+-------------+
|   31402|      60|       12|           0|            88|             42|              0|          0|         0|        4|            0|
+--------+--------+---------+------------+--------------+---------------+---------------+-----------+----------+---------+-------------+
# Group by and aggregate to count true values in each column
subset_counts1 = (
    filtered_news_submissions
    .agg(
        sum(col("contains_ai").cast("integer")).alias("ai_count"),
        sum(col("contains_ml").cast("integer")).alias("ml_count"),
        sum(col("contains_nlp").cast("integer")).alias("nlp_count"),
        sum(col("contains_vision").cast("integer")).alias("vision_count"),
        sum(col("contains_robotics").cast("integer")).alias("robotics_count"),
        sum(col("contains_assistant").cast("integer")).alias("assistant_count"),
        sum(col("contains_analytics").cast("integer")).alias("analytics_count"),
        sum(col("contains_cloud").cast("integer")).alias("cloud_count"),
        sum(col("contains_edge").cast("integer")).alias("edge_count"),
        sum(col("contains_iot").cast("integer")).alias("iot_count"),
        sum(col("contains_quantum").cast("integer")).alias("quantum_count")
    ))
subset_counts1.show()
[Stage 8:=======================================================>(99 + 1) / 100]                                                                                
+--------+--------+---------+------------+--------------+---------------+---------------+-----------+----------+---------+-------------+
|ai_count|ml_count|nlp_count|vision_count|robotics_count|assistant_count|analytics_count|cloud_count|edge_count|iot_count|quantum_count|
+--------+--------+---------+------------+--------------+---------------+---------------+-----------+----------+---------+-------------+
|    2283|      69|        6|           0|            70|             30|              0|          0|         0|       93|            0|
+--------+--------+---------+------------+--------------+---------------+---------------+-----------+----------+---------+-------------+
# Define the counts and corresponding keywords
counts = [31402, 60, 12, 0, 88, 42, 0, 0, 0, 4, 0]  
keywords = ["AI", "ML", "NLP", "Vision", "Robotics", "Assistant", "Analytics", "Cloud", "Edge", "IoT", "Quantum"]
plt.rcParams["figure.dpi"] = 300

# Create a bar plot
plt.figure(figsize=(10, 6))
plt.bar(keywords, counts, color='skyblue')

# Add labels and title
plt.xlabel('Keywords')
plt.ylabel('Total Number')
plt.title('Counts of Comment Number for Each Subset')

# Rotate x-axis labels for better readability
plt.xticks(rotation=45, ha='right')

# Show plot
plt.tight_layout()
plt.show()

#import matplotlib.pyplot as plt
# Define the counts and corresponding keywords
counts = [2283, 69, 6, 0, 70, 30, 0, 0, 0, 93, 0]  
keywords = ["AI", "ML", "NLP", "Vision", "Robotics", "Assistant", "Analytics", "Cloud", "Edge", "IoT", "Quantum"]
plt.rcParams["figure.dpi"] = 300

# Create a bar plot
plt.figure(figsize=(10, 6))
plt.bar(keywords, counts, color='skyblue')

# Add labels and title
plt.xlabel('Keywords')
plt.ylabel('Total Number')
plt.title('Counts of Submission Number for Each Subset')

# Rotate x-axis labels for better readability
plt.xticks(rotation=45, ha='right')

# Show plot
plt.tight_layout()
plt.show()

5. Analysis of Technology News Coverage Over Time

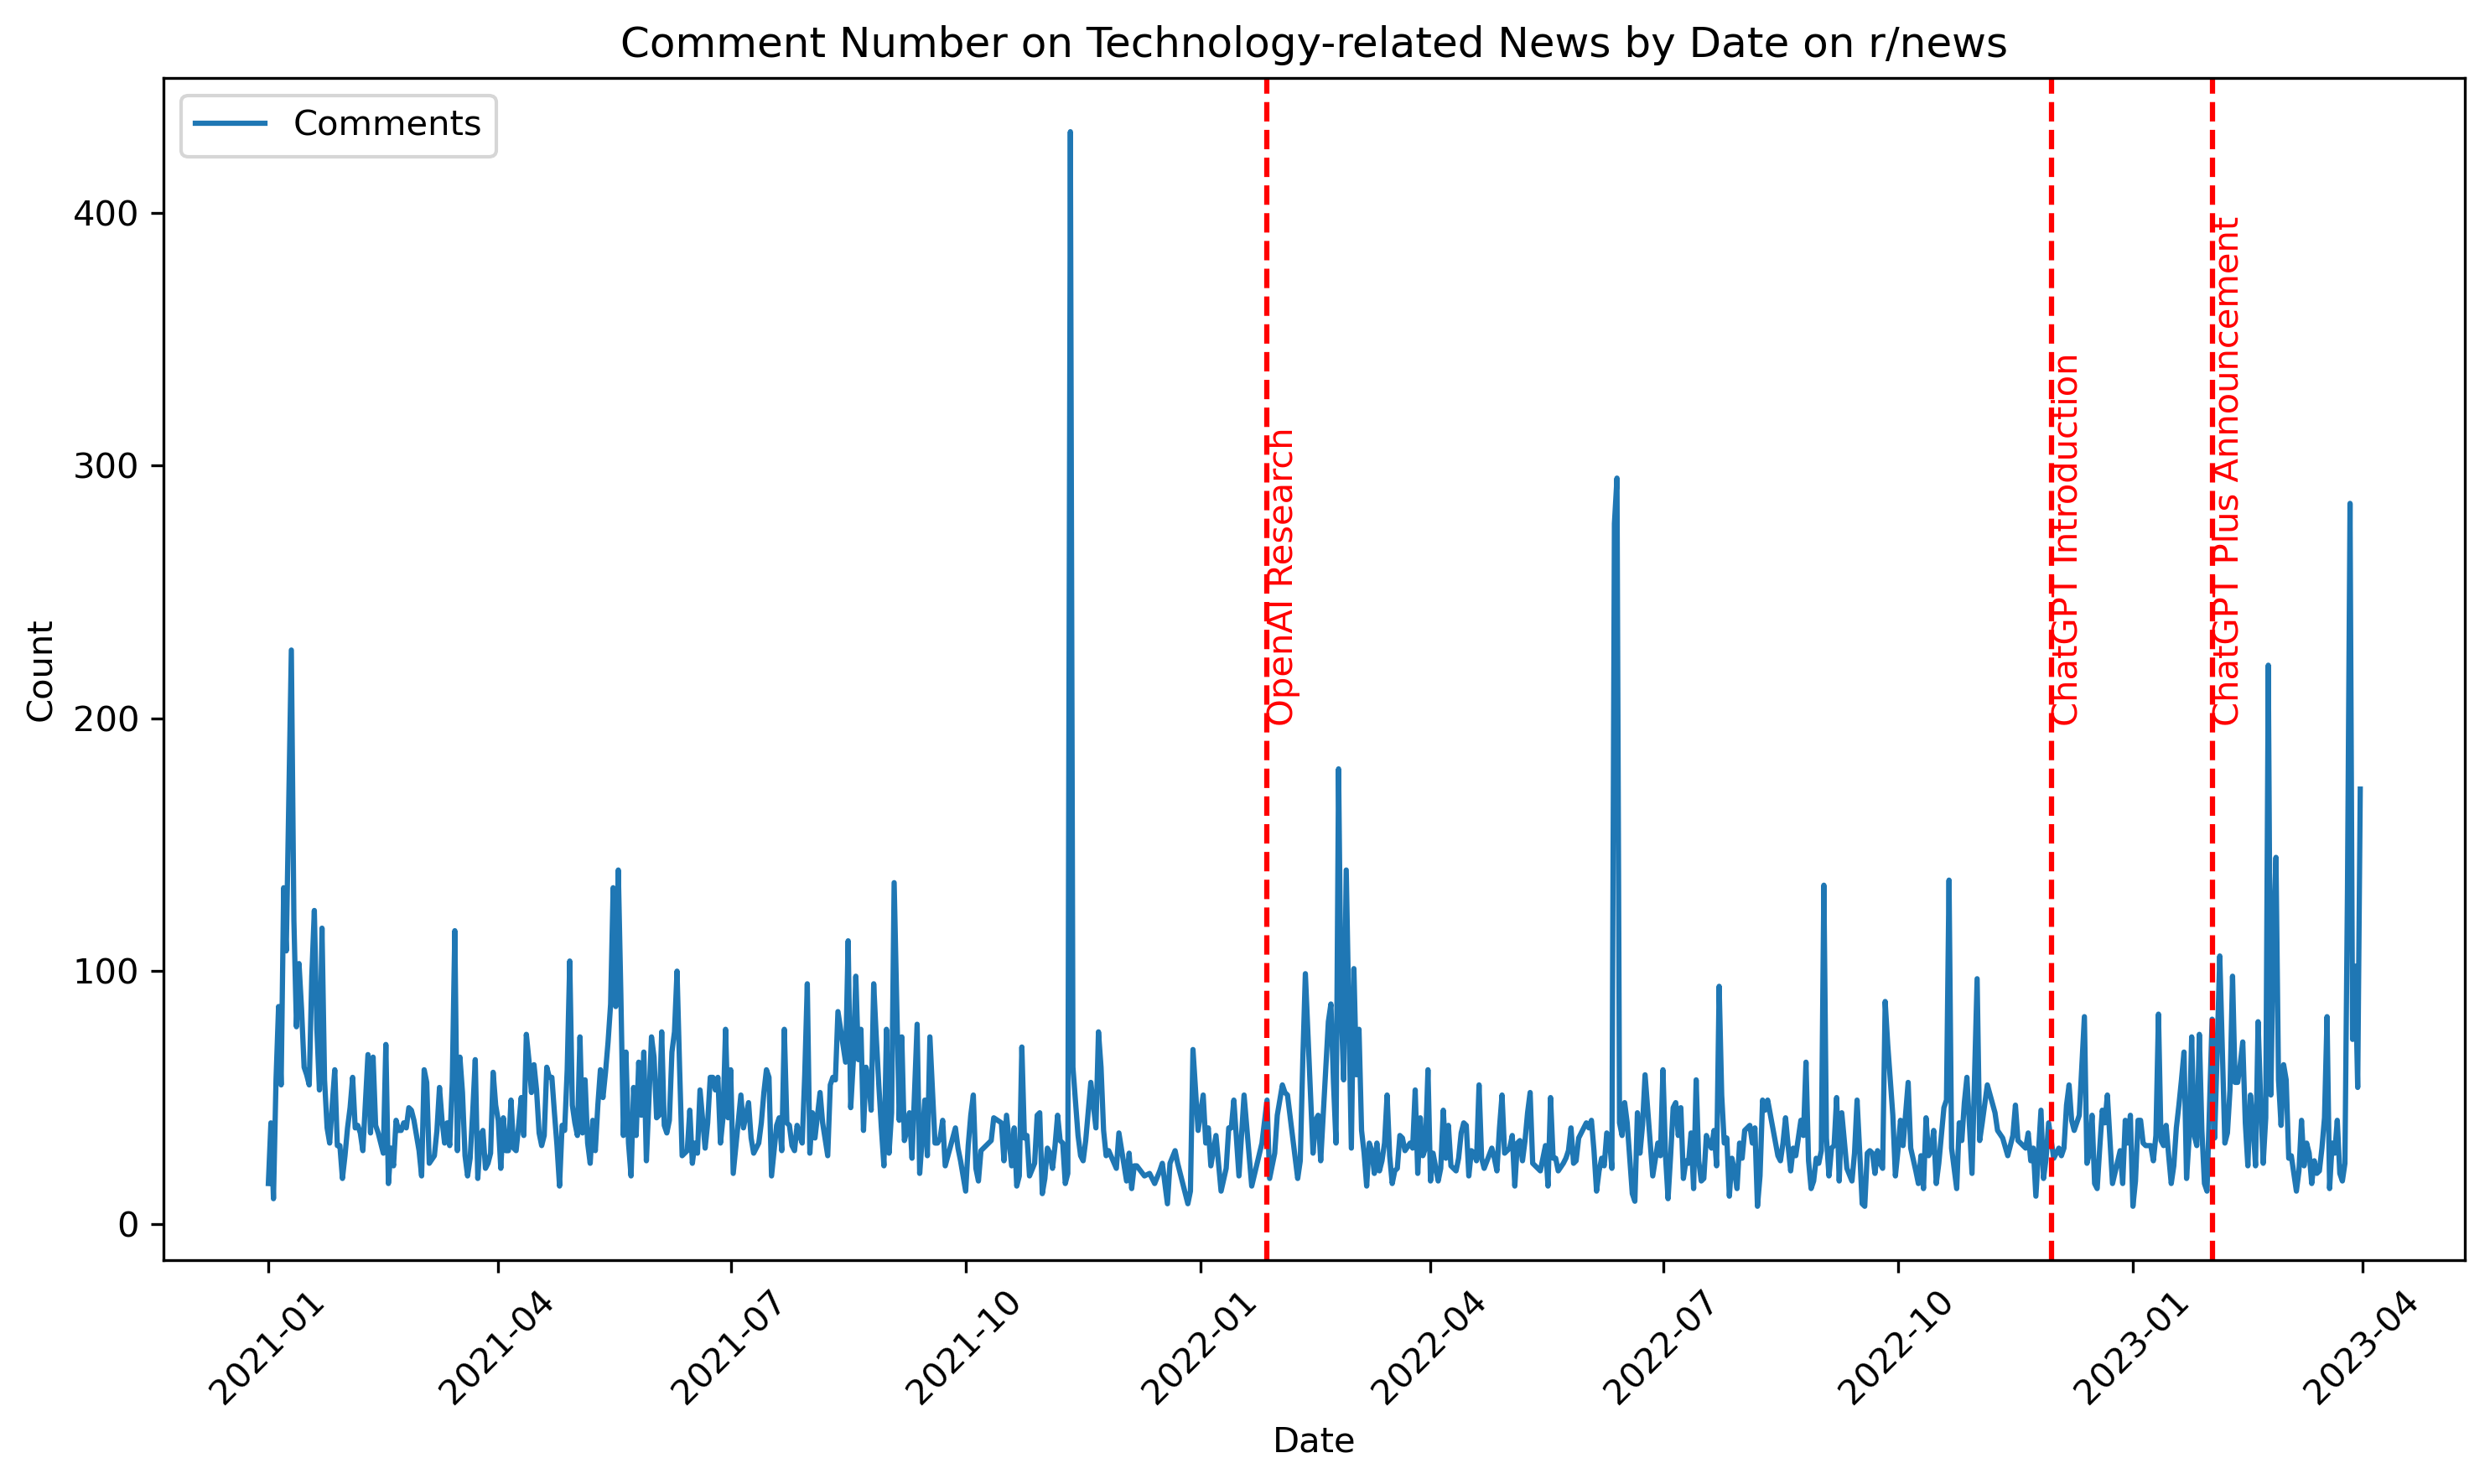
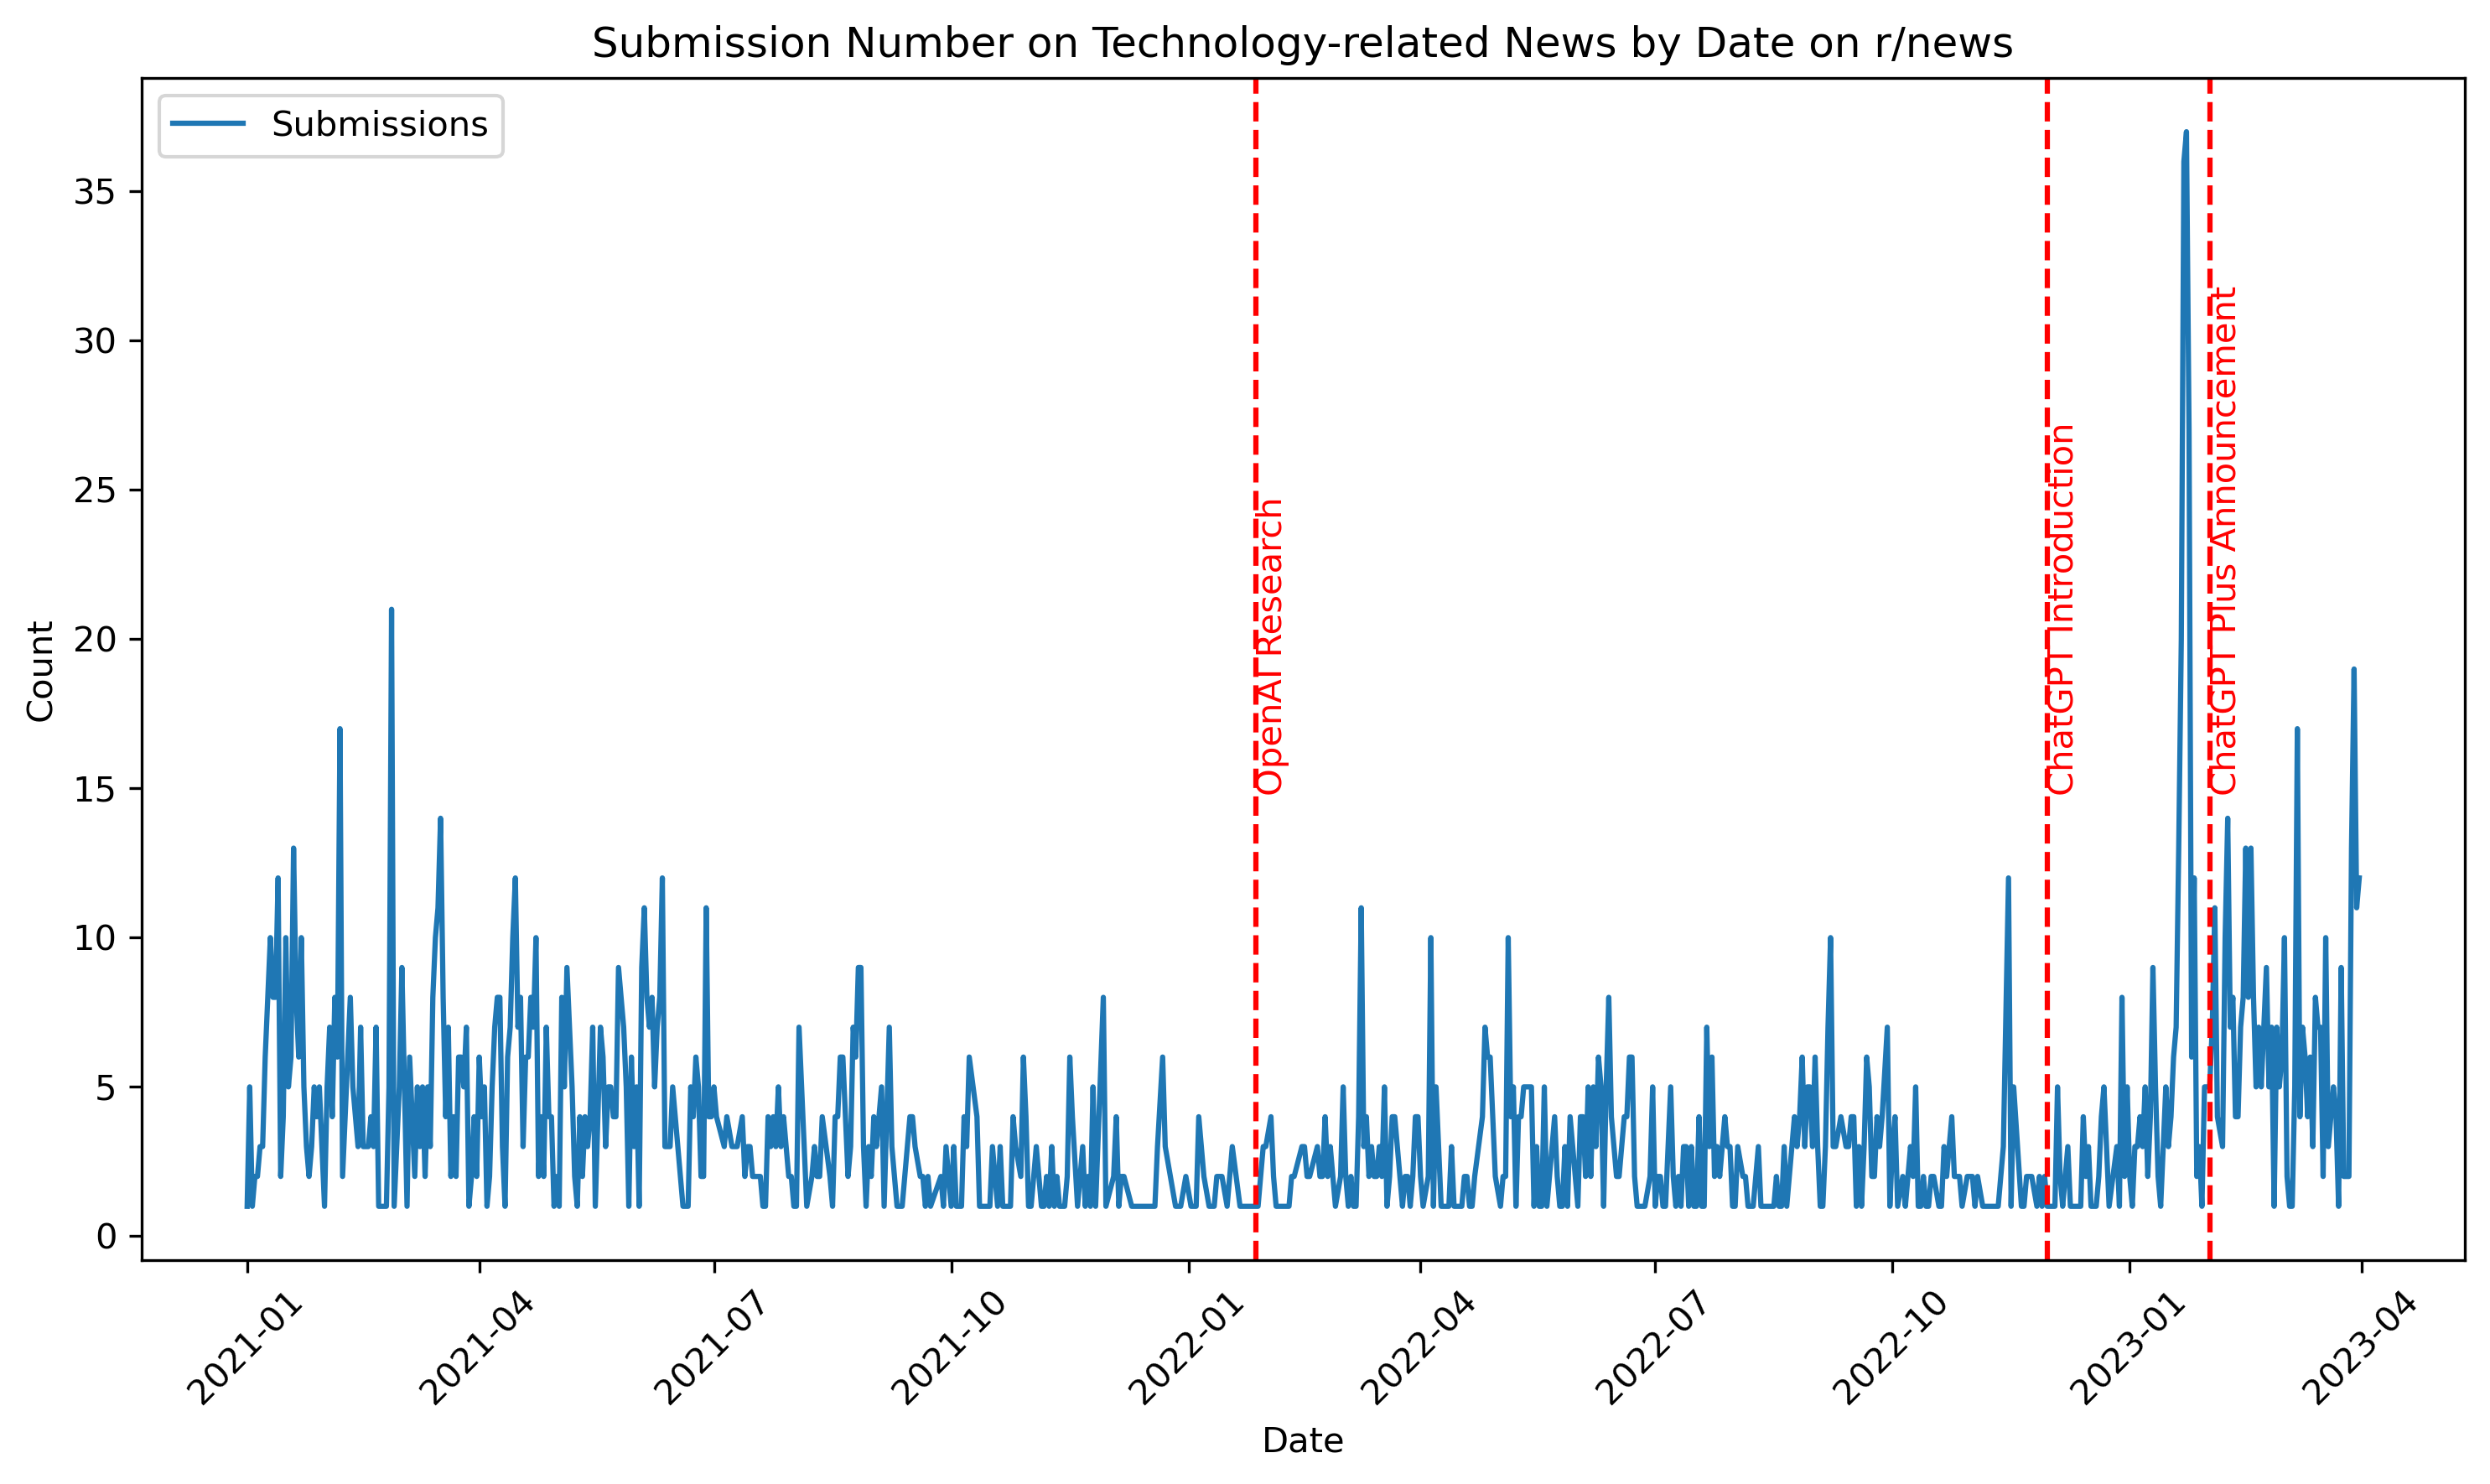
Following the filtration of news articles within the technology domain using keyword matching, our aim is to examine whether significant events coincide with notable increases in technology news coverage over distinct time periods. This analysis seeks to identify correlations between major tech events and spikes in the number of reported news articles, offering insights into the impact of key developments on media attention within the technology sector.

from pyspark.sql.functions import desc
news_sub_date_count = filtered_news_submissions.groupBy('created_date').agg(count("created_date")\
                                                                         .alias("subs_count")).sort(desc('subs_count'))
news_com_date_count = filtered_news_comments.groupBy('created_date').agg(count("created_date")\
                                                                      .alias("comments_count")).sort(desc('comments_count'))
news_date_count = news_sub_date_count.join(news_com_date_count, "created_date")
news_date_count = news_date_count.na.fill(0)
news_date_df = news_date_count.toPandas()
                                                                                
news_date_df.head()
created_date subs_count comments_count
0 2021-04-15 12 63
1 2021-10-23 1 70
2 2021-03-30 4 60
3 2021-03-07 2 27
4 2021-11-19 1 56
news_date_df.to_csv('News_Date.csv',index=False)
import matplotlib.pyplot as plt
import pandas as pd

news_date_df1 = news_date_df.reset_index()
# Convert 'created_date' column to datetime
news_date_df1['created_date'] = pd.to_datetime(news_date_df1['created_date'])

# Sort the DataFrame by 'created_date' column
news_date_df1 = news_date_df1.sort_values(by='created_date')

plt.figure(figsize=(10, 6))
plt.rcParams["figure.dpi"] = 300

# Plot submissions
#plt.plot(tech_date_df1['created_date'], tech_date_df1['subs_count'], label='Submissions')

# Plot comments
plt.plot(news_date_df1['created_date'], news_date_df1['comments_count'], label='Comments')

# Add vertical lines for significant events
plt.axvline(x=pd.to_datetime('2022-01-27'), color='red', linestyle='--')
plt.text(pd.to_datetime('2022-01-27'), 200, "OpenAI Research", color='red', rotation=90)

plt.axvline(x=pd.to_datetime('2022-11-30'), color='red', linestyle='--')
plt.text(pd.to_datetime('2022-11-30'), 200, "ChatGPT Introduction", color='red', rotation=90)

plt.axvline(x=pd.to_datetime('2023-02-01'), color='red', linestyle='--')
plt.text(pd.to_datetime('2023-02-01'), 200, "ChatGPT Plus Announcement", color='red', rotation=90)

# Add labels, title, and legend
plt.xlabel('Date')
plt.ylabel('Count')
plt.title('Comment Number on Technology-related News by Date on r/news')
plt.legend()

# Show plot
plt.xticks(rotation=45)
plt.tight_layout()
plt.show()

plt.figure(figsize=(10, 6))
plt.rcParams["figure.dpi"] = 300

# Plot submissions
plt.plot(news_date_df1['created_date'], news_date_df1['subs_count'], label='Submissions')

# Plot comments
#plt.plot(news_date_df1['created_date'], news_date_df1['comments_count'], label='Comments')

# Add vertical lines for significant events
plt.axvline(x=pd.to_datetime('2022-01-27'), color='red', linestyle='--')
plt.text(pd.to_datetime('2022-01-27'), 15, "OpenAI Research", color='red', rotation=90)

plt.axvline(x=pd.to_datetime('2022-11-30'), color='red', linestyle='--')
plt.text(pd.to_datetime('2022-11-30'), 15, "ChatGPT Introduction", color='red', rotation=90)

plt.axvline(x=pd.to_datetime('2023-02-01'), color='red', linestyle='--')
plt.text(pd.to_datetime('2023-02-01'), 15, "ChatGPT Plus Announcement", color='red', rotation=90)

# Add labels, title, and legend
plt.xlabel('Date')
plt.ylabel('Count')
plt.title('Submission Number on Technology-related News by Date on r/news')
plt.legend()

# Show plot
plt.xticks(rotation=45)
plt.tight_layout()
plt.show()