Q9: Predict Stock Price
Correlating Public and Media Sentiment Scores on Reddit with Stock Price Movements of Top Tech Companies
In our study we’ve used a dataset that blends stock prices of leading tech firms with sentiment ratings culled from Reddit. Specifically we gathered stock information for Microsoft, Nvidia, Adobe, Alphabet and Amazon through the Yahoo Finance API. The analysis period covers January 1, 2021 to February 28, 2023 capturing adjusted closing prices for these stocks. This financial data serves as the foundation of our research by allowing us to monitor the stock performance of each company over a timeframe.
Simultaneously we gathered sentiment ratings from Reddits r/Technology and r/News communities. These ratings offer a nuanced insight into media attitudes towards technology related subjects. Sentiment scores were compiled for technology related terms and ideas (such as “chatgpt,” “aurora,” “metaverse”) reflecting the prevailing sentiments surrounding these topics on days.
Our preprocessing steps entailed combining these two datasets based on date to ensure that every stock price entry corresponds with the sentiment scores from that day. This synchronization is vital for evaluating how public opinion and media sentiments influence stock movements.
Model Development: Linear Regression Analysis
For the next step, we apply a regression model to analyze the five tech companies: Microsoft, Nvidia, Adobe, Alphabet, and Amazon. We developed separate models for each company to analyze their stock price trends. The first model we choose is Linear regression for its suitability in measuring how changes in sentiment scores influence stock prices. Our dataset was divided into two parts: training (70% of the data) and testing sets (30% of the data). The division ensures that our model can be accurately assessed on data bolstering its dependability and resilience.
Initial Evaluation
Upon our assessment of the models using the Root Mean Square Error (RMSE) metric, we observed varying outcomes across companies. The diversity in RMSE values among these companies underscores how public and media sentiment can influence tech companies differently due to factors such as company size, market impact, and public perception. For example, the model forecasting Alphabets stock prices demonstrated the RMSE value indicating a precise correlation between sentiments extracted from Reddit and Alphabets stock performance. In contrast, Adobe showed the highest RMSE, suggesting a weaker predictive relationship.
Table 1: Five Companies’ RMSE Before Regularization
| Stock | RMSE |
|---|---|
| MSFT | 28.795 |
| NVDA | 47.213 |
| ADBE | 103.429 |
| GOOGL | 16.726 |
| AMZN | 26.894 |
After reviewing the findings, we decided to improve model accuracy and prevent overfitting. We implemented regularization techniques, specifically Ridge and Lasso regression.
Ridge Regression: This approach involves adjusting the model by incorporating a penalty to the square of the coefficient magnitude. This limits the flexibility of the model thereby reducing the risk of overfitting.
Lasso Regression: Unlike Ridge Regression, Lasso (Least Absolute Shrinkage and Selection Operator) does not penalize sizes but also has the ability to decrease the dependency on certain variables within the solution. This is achieved by assigning zero values to some coefficients related to variables essentially conducting variable selection.
Results with Regularization
The RMSE for Alphabet’s stock price predictions improved slightly with Ridge regularization and even more with Lasso. The Lasso model, which also helps in feature selection by reducing some coefficients to zero, provided the lowest RMSE, indicating that it was the most effective model in predicting stock prices based on Reddit sentiment.
Table 2: Alphabet’s RMSE with Regularization
| Model | RMSE |
|---|---|
| RMSE (Ridge) | 16.432 |
| RMSE (Lasso) | 16.234 |
| RMSE (No Regularization) | 16.726 |
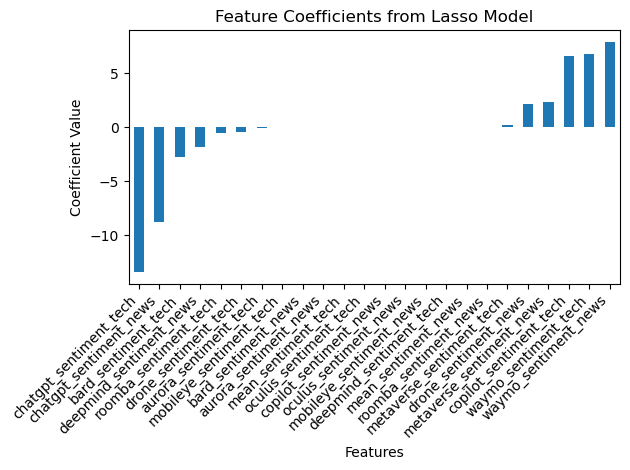
The coefficient plot from the Lasso model visually represented the influence of each sentiment metric on Alphabet’s stock prices. Each bar represents a different sentiment indicator from Reddit, showing how much each one sways Alphabet’s stock price up or down. For example, sentiments related to chatgpt and waymo showed strong negative and positive influences, respectively. This suggests that negative news or public sentiment around certain tech topics could lead to a decrease in stock prices, whereas positive sentiment could boost stock value. This visualization captures the ebb and flow of market dynamics influenced by public discourse, revealing which topics spark positive excitement and which ones stir concern among investors and the public alike. It’s a striking demonstration of how closely the fates of technology giants are intertwined with public sentiment, captured through the lens of social media. Notably, the coefficients of some features have been shrunk towards zero, which is a characteristic effect of Lasso regularization, emphasizing features that contribute the most to predicting the target variable while discarding less relevant ones.
This detailed analysis demonstrates the capability of linear regression models, enhanced by regularization techniques, to effectively decode the intricate dynamics between online sentiments and stock market movements. The findings underscore the potential of data-driven, machine learning approaches in financial analyses and investment strategies, particularly in how they can leverage vast amounts of online data to forecast market trends.
Model Development: Decision Tree and Random Forest Analysis
Next, we use Decision Tree and Random Forest models to study five technology companies: Microsoft, Nvidia, Adobe, Alphabet, and Amazon. When comparing the effectiveness of these models in predicting stock prices, it’s evident that the Random Forest model consistently outperforms the Decision Tree model. The strength of the Random Forest lies in its approach where multiple decision trees work together to offer precise predictions compared to a single Decision Tree that might overlook certain data complexities.
The Random Forest model performs better for its RMSE scores when compared to those of the Decision Tree indicating that its predictions are closer to the stock prices. This superiority is exemplified in Alphabets stock (GOOGL) where the Random Forest model achieves the RMSE and surpasses models.
Table 3: Random Forest vs. Decision Tree for Five Companies
| Stock | Model | RMSE |
|---|---|---|
| MSFT | Random Forest | 27.000 |
| MSFT | Decision Tree | 34.301 |
| NVDA | Random Forest | 49.264 |
| NVDA | Decision Tree | 65.464 |
| ADBE | Random Forest | 98.671 |
| ADBE | Decision Tree | 122.141 |
| GOOGL | Random Forest | 16.092 |
| GOOGL | Decision Tree | 20.538 |
| AMZN | Random Forest | 25.373 |
| AMZN | Decision Tree | 30.854 |
Feature Importance
To enhance our analysis further we have delved into feature importance within the Random Forest model. This ranking system evaluates each variable based on its impact on predictions, shedding light on which sentiment indicators from Reddit hold weight, in influencing stock prices. The visual representation of feature importance provides an insight into this ranking. chatgpt_sentiment_tech leads the pack as the factor influencing the models forecasts, followed by metaverse_sentiment_tech, mean_sentiment_tech, and mean_sentiment_news indicating their significance in predicting stock trends. On the other hand, bard_sentiment_tech shows impact suggesting it lacks predictive power in this scenario.
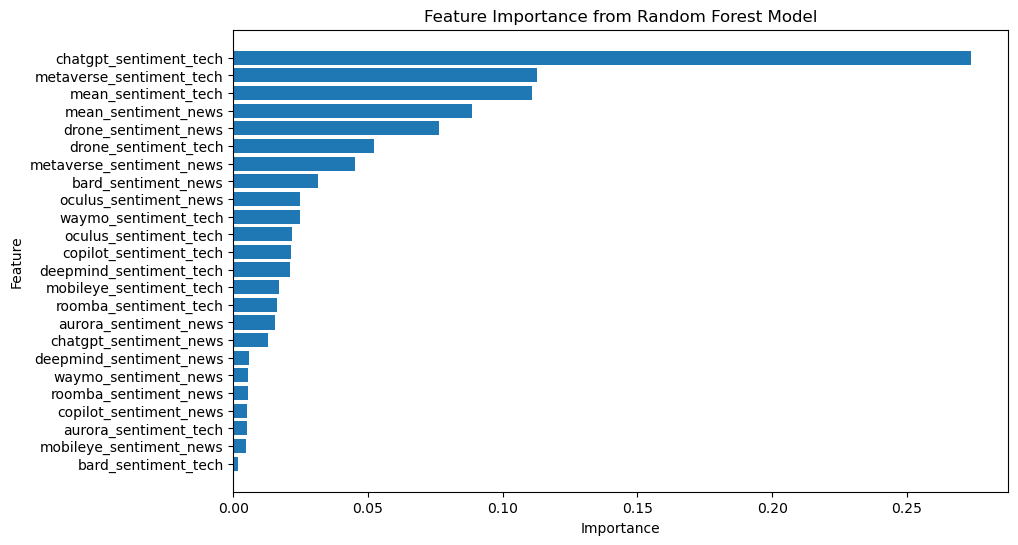
This visualization offers an overview of the data’s structure highlighting which variables deserve scrutiny when forecasting stock prices and enhancing model accuracy. To sum up the feature importance plot of the Random Forest model serves as a tool for identifying factors in predicting stock market shifts, crucial knowledge for making informed decisions, in finance.